
Fig. 1: Diversity of cell types in CoM and nonmalignant conjunctival samples annotated by scRNA-seq.
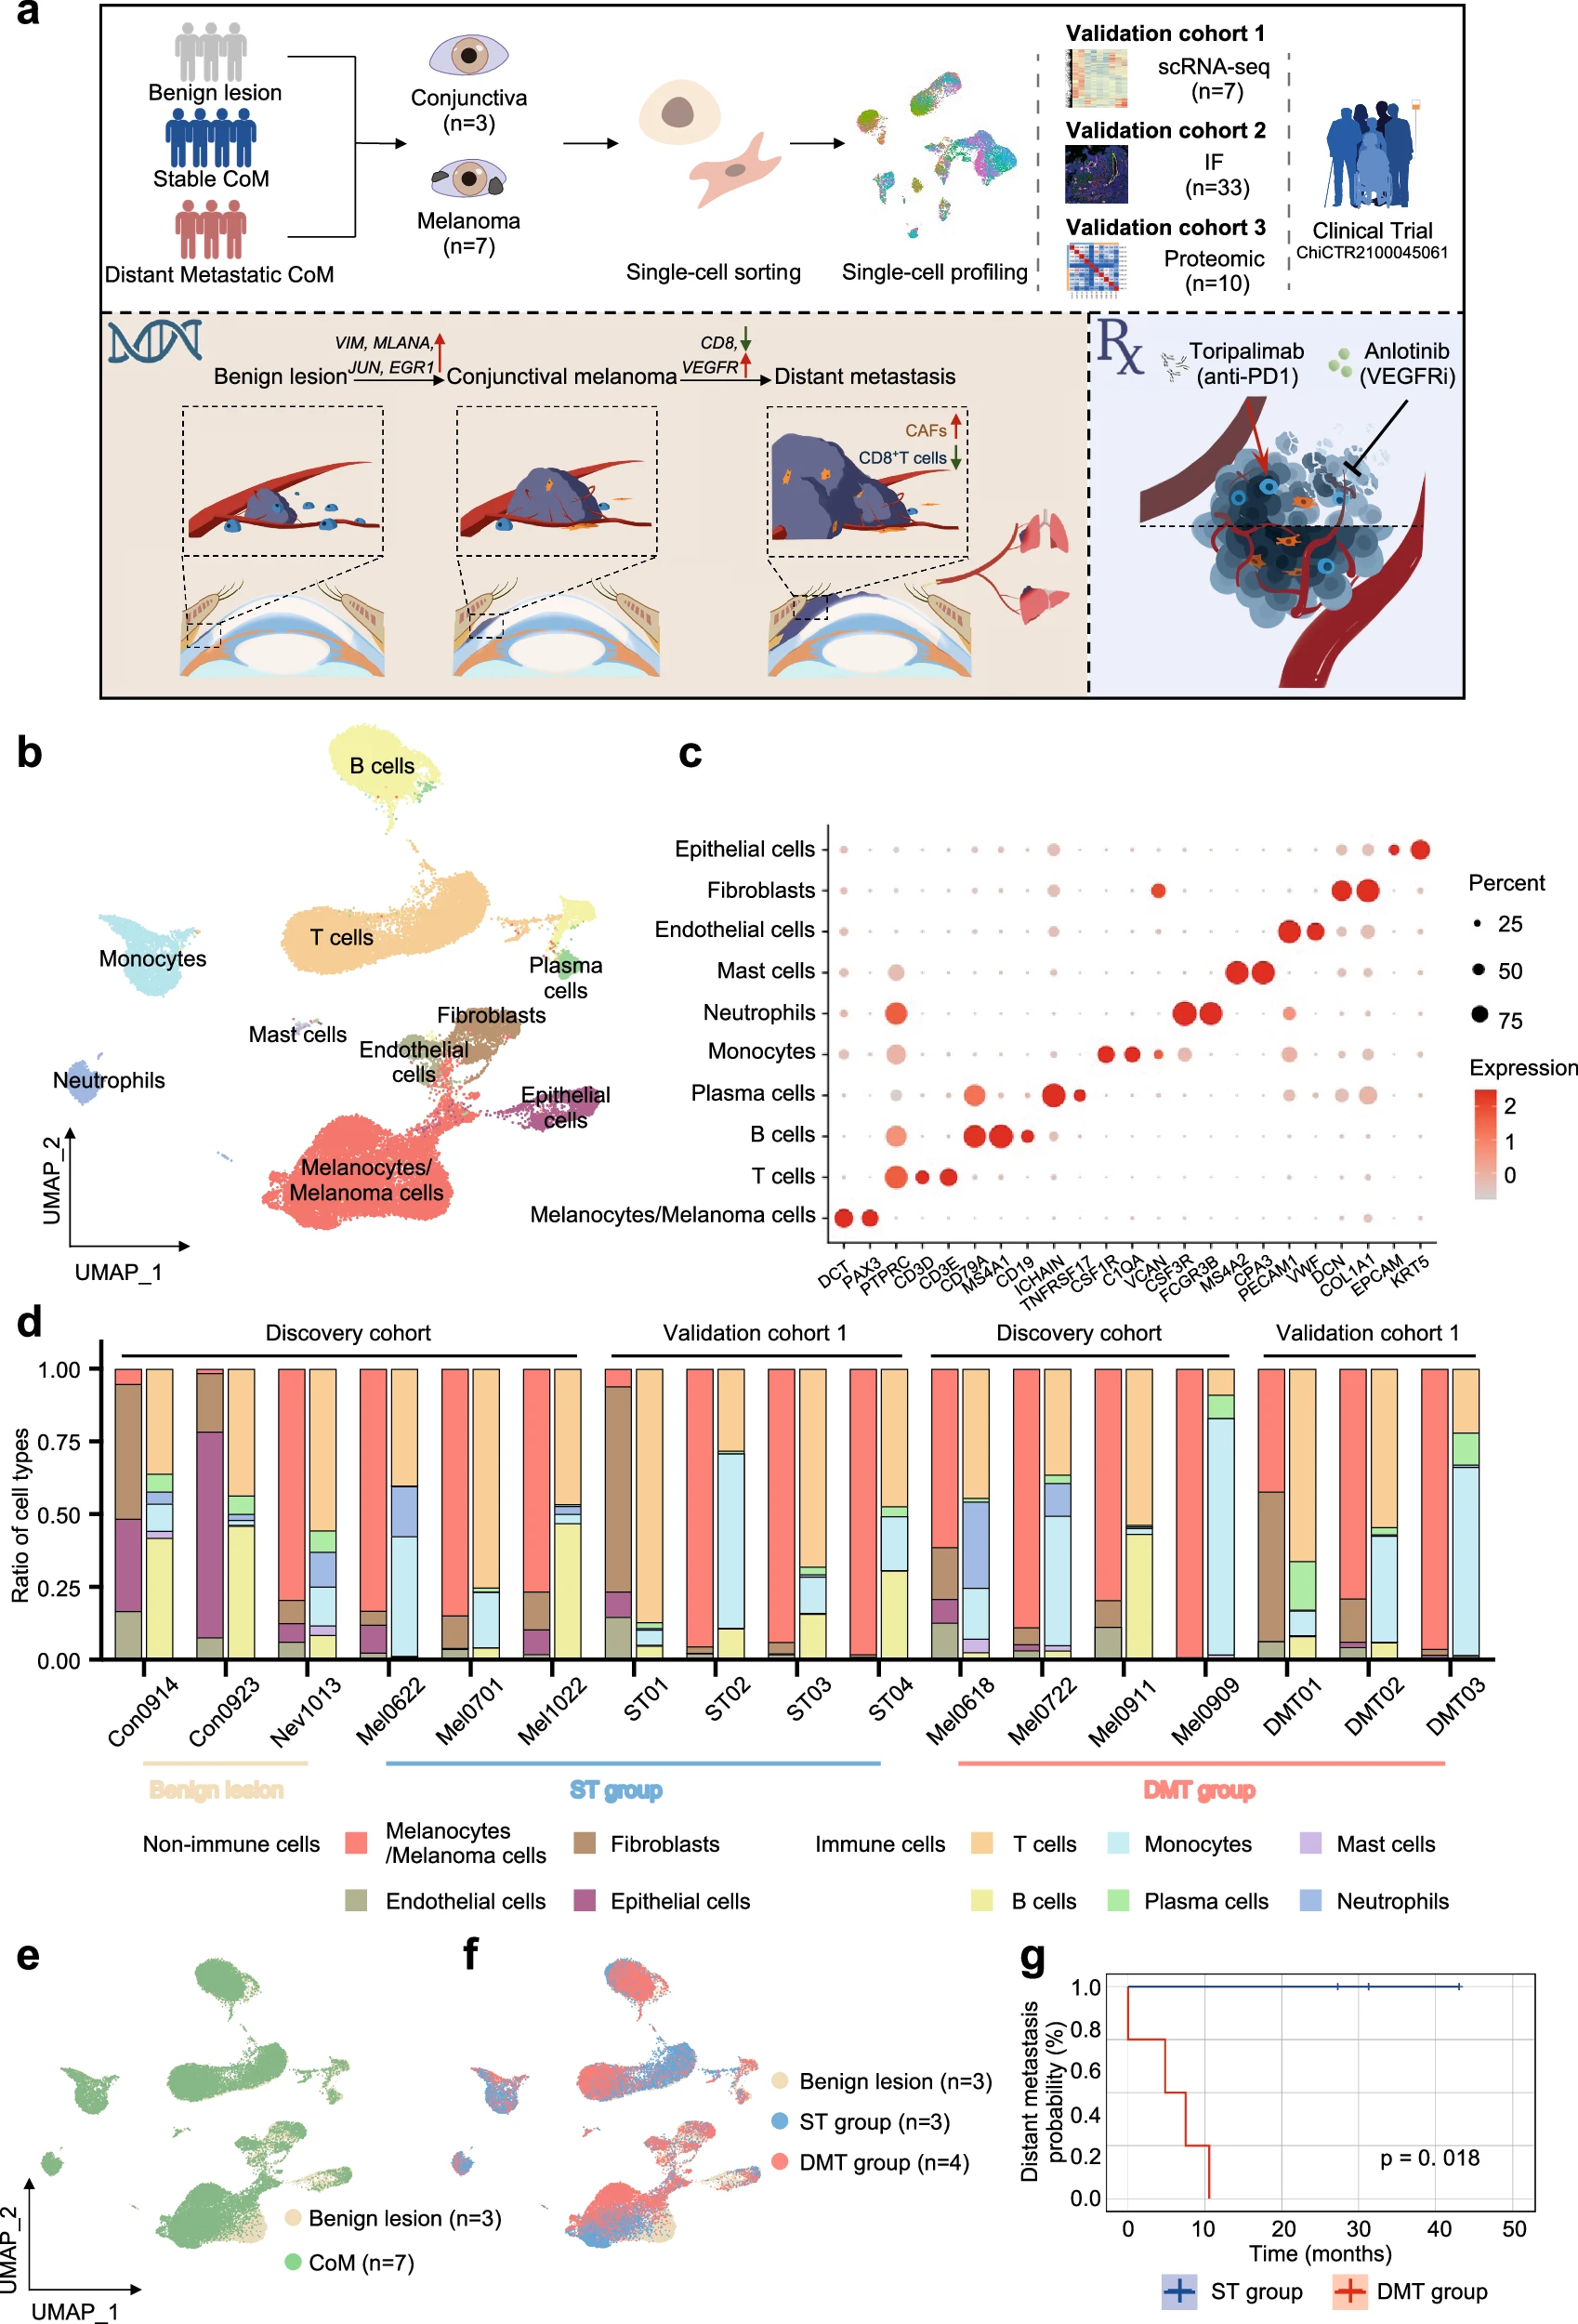
a Schematic representation of the experimental strategy, indicating the collection and administration of samples from patients with CoM and nonmalignant conjunctiva. b UMAP plot illustrating the annotation of diverse cell types in CoM and nonmalignant conjunctival tissues. c Dot plot showing expression levels of specific cell marker genes in different cell types. The size of the dot suggests the proportion of cells expressing the marker genes. The spectrum of colors indicates the mean expression levels of the marker genes. d Bar plots indicating the proportion of annotated cell types in 3 nonmalignant samples (2 conjunctival samples and 1 conjunctival nevus), 14 primary CoM samples (discovery cohort: n = 7, validation cohort 1: n = 7). The annotated cell types and colors are presented in the bottom. e, f UMAP plot showing cell origins by color: benign or melanoma origin (e) benign lesion in white and melanoma in green, and ST or DMT origin (f) ST group in blue and DMT group in red. g Progression-free survival based on distant metastasis in CoM patients from ST (blue) and DMT (red) group enrolled in the scRNA-seq cohort.
