
Fig. 2: Differential gene expression signatures reveal triggers for tumorigenesis and metastasis of CoM.
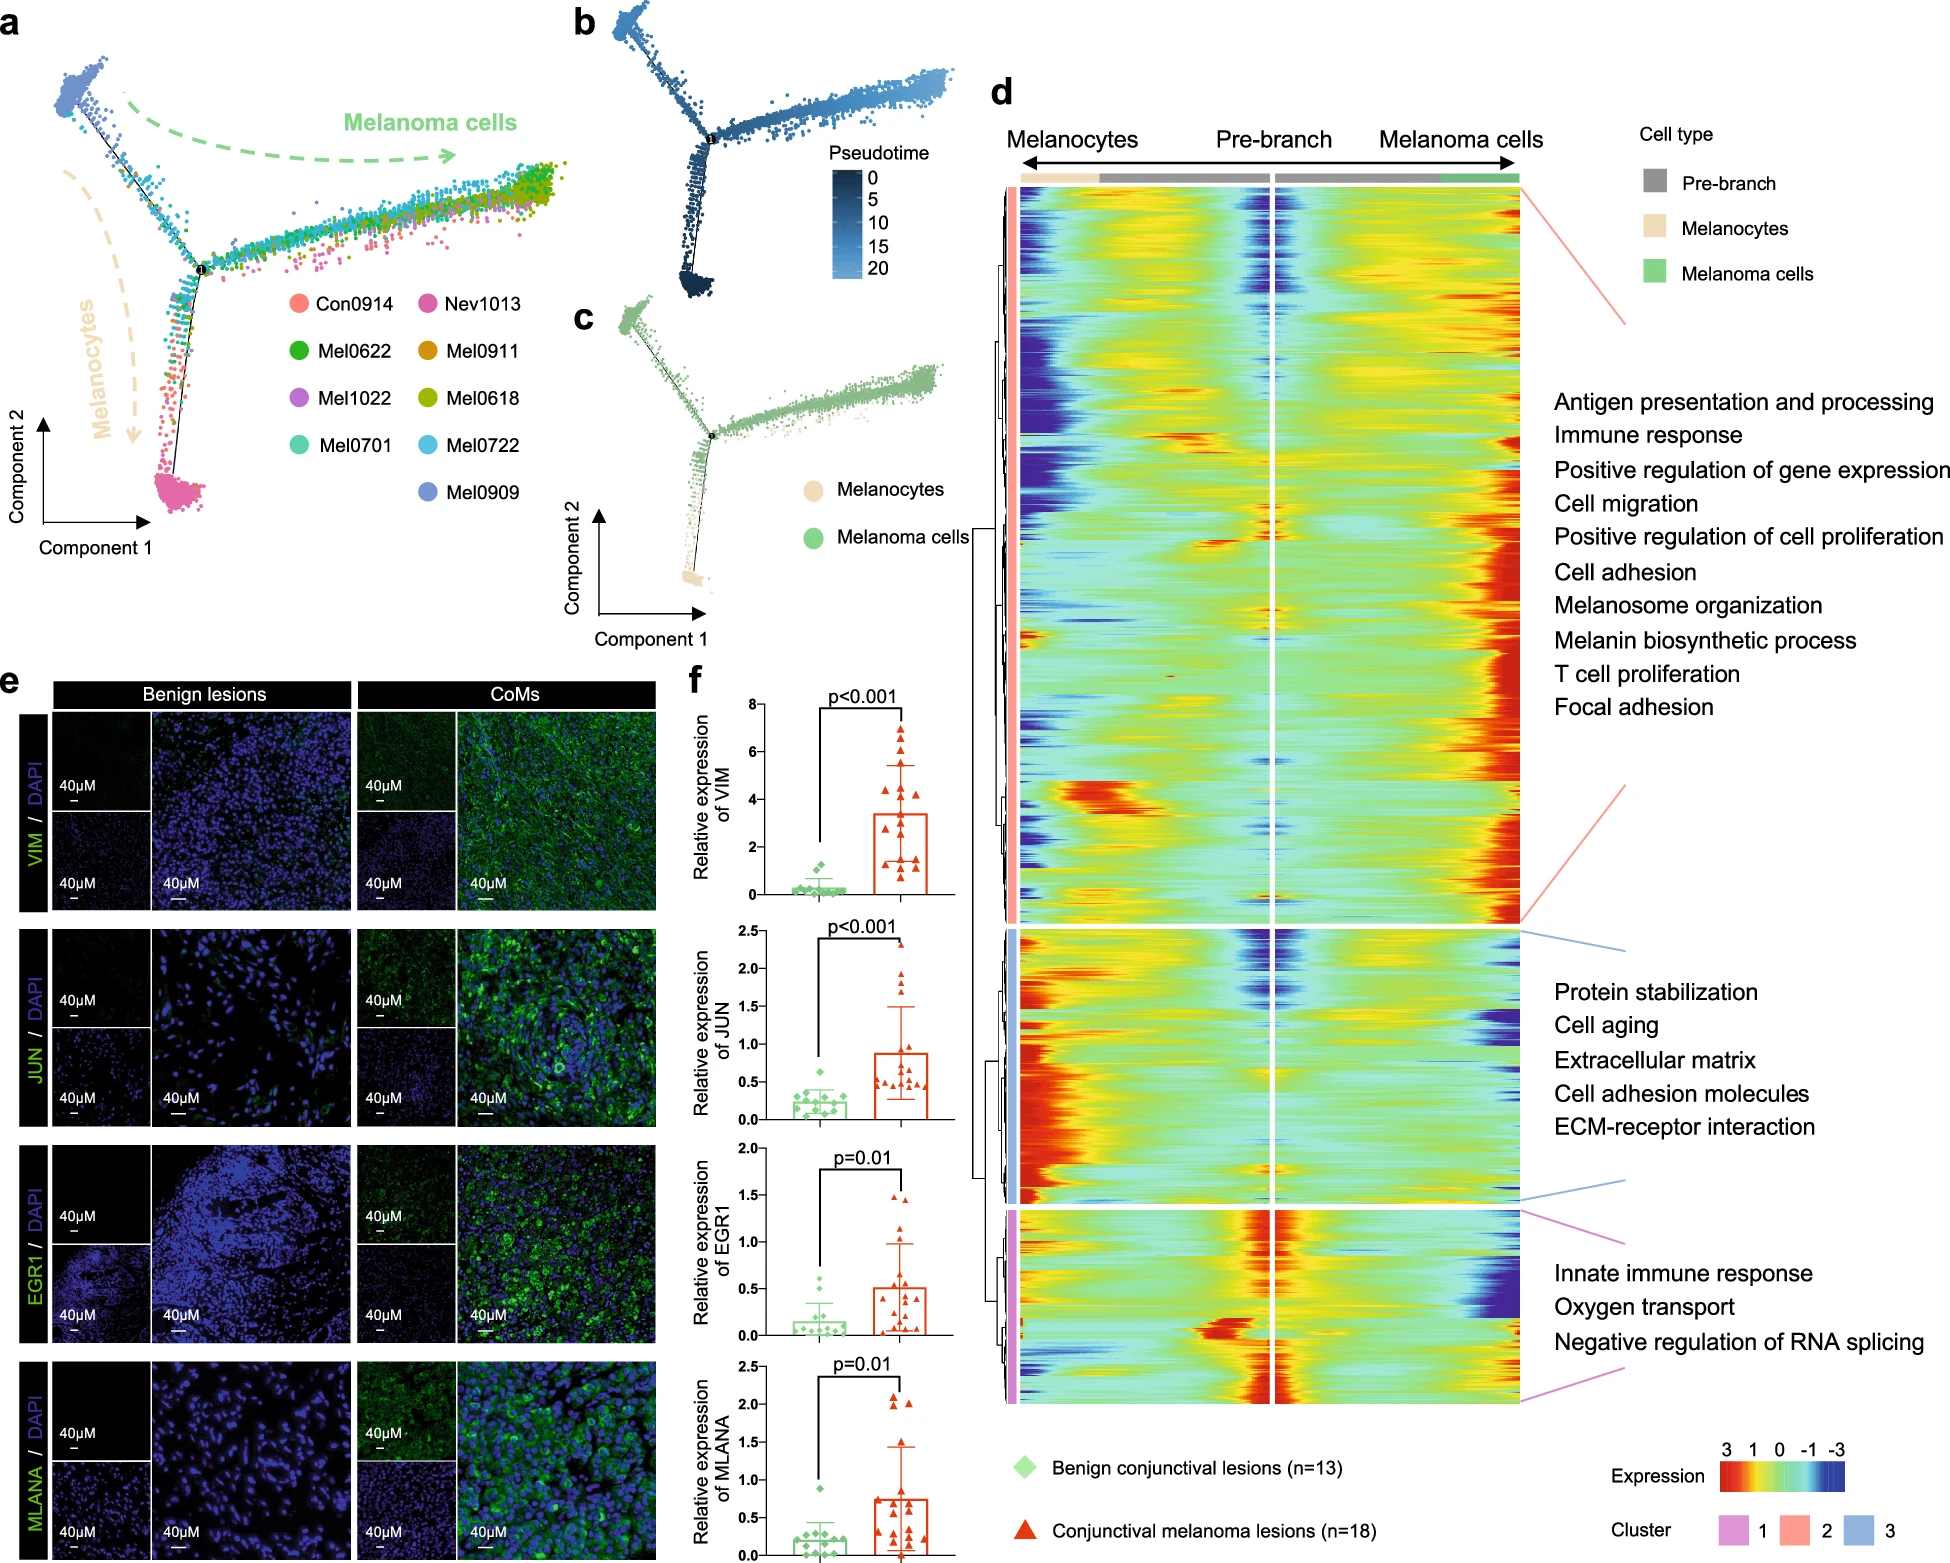
a Transcriptional trajectory analysis of 3041 melanocytes and 11,964 melanoma cells from all conjunctival samples colored by patient ID. b The transcriptional trajectory of a differential process is visually represented using color-coded states, wherein each data point corresponds to an individual cell. The range of colors employed signifies the diverse states of both melanocytes and melanoma cells. Both branches emanate from a shared progenitor state (located on the left), with the right branch denoting the progression towards melanoma cells and the downward branch indicating the transition towards melanocytes. c Pseudotime analysis was employed to compare the distribution between melanocytes and melanoma cells. Each data point refers to an individual cell. Melanocytes are labeled in white while melanoma cells in green. d Heatmap shows upregulated or downregulated genes in the differentiation process. The differentially expressed genes (rows) along the pseudotime (columns) were hierarchically clustered into three subclusters. The representative enriched pathways of each subcluster are provided. e Representative images of IF staining in FFPE tissues from validation cohort, indicating VIM-, JUN-, MLANA- and EGR1-positive cells, in benign lesion and CoM tissue sections. Scale bars, 40 μm. f Averaged expression of VIM, JUN, MLANA and EGR1 in nonmalignant conjunctival lesions (green) and CoM tissues (red) from validation cohort, based on IF staining results. All statistical analyses are two-tailed unpaired Student’s t-test, n represents the number of samples from patients.
