
Fig. 4: scRNA-seq profiling of the tumor immune microenvironment in CoM.
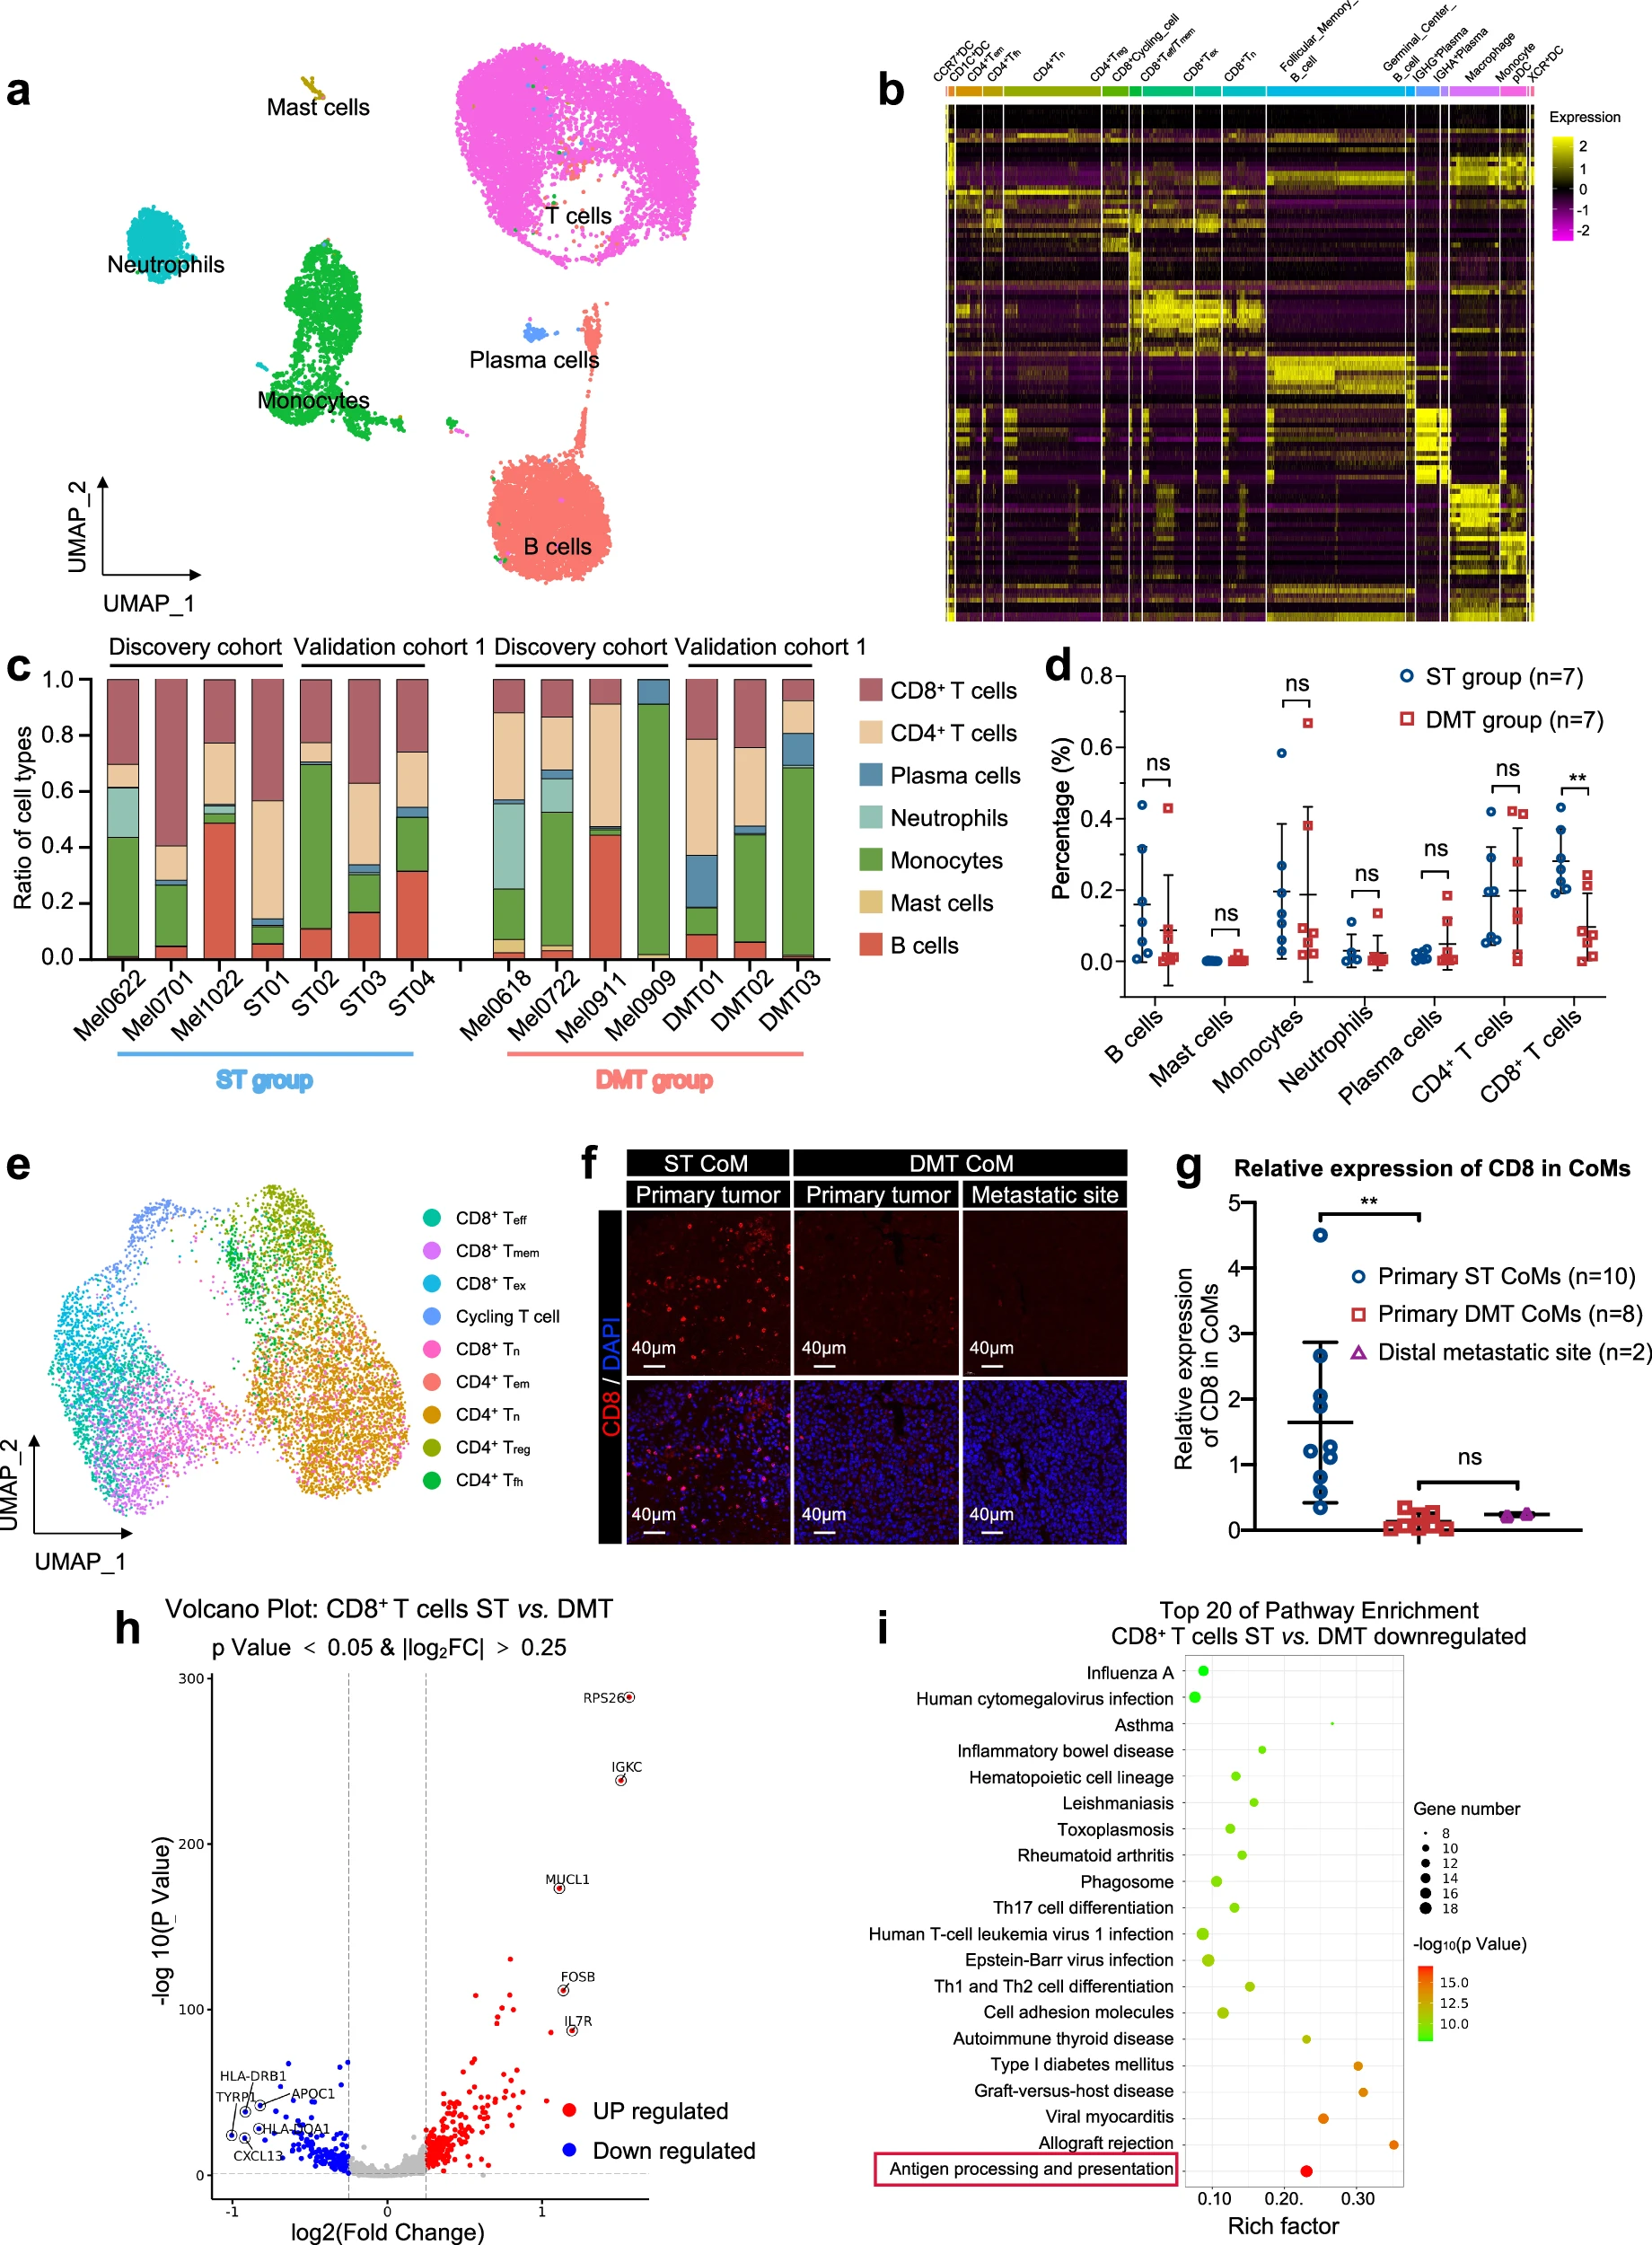
a UMAP plot showing immune cell types in CoM samples, labeled in different colors. b Heatmap plot showing the expression levels of marker genes in each subtype of immune cells. c Bar plots showing the proportion of annotated cell types in 7 samples from the ST group and 7 samples from the DMT group. d Proportion of each immune cell subset in the ST group and DMT group from both discovery cohort and validation cohort 1. Two-tailed unpaired Student’s t-test. e UMAP plot showing the T cell subsets from all 7 CoM samples in discovery cohort, labeled in different colors. f IF staining with CD8 antibody in CoM tissue sections and distal metastatic sites, from ST and DMT groups separately. Distal metastatic sites from DMT CoM patients were included in DMT group. The representative images were displayed (ST group: primary CoM tissues, n = 2, left; DMT group: primary CoM tissues, n = 2, middle; distal metastatic lesions, n = 2, right). Scale bars, 40 μm. g Average expression of CD8 in the primary ST CoMs, primary DMT CoMs, and distal metastatic sites according to the results of IF staining (One-way ANOVA). h Volcano plots of differentially expressed genes in CD8+ T cells between ST group and DMT group. i Bubble plots of downregulated genes in CD8+ T cells between ST group and DMT group enriched pathways. The top 20 processes were displayed.
