
Fig. 5: CD8+ T cells play crucial roles in the distinctive immune microenvironment of distant metastatic CoM.
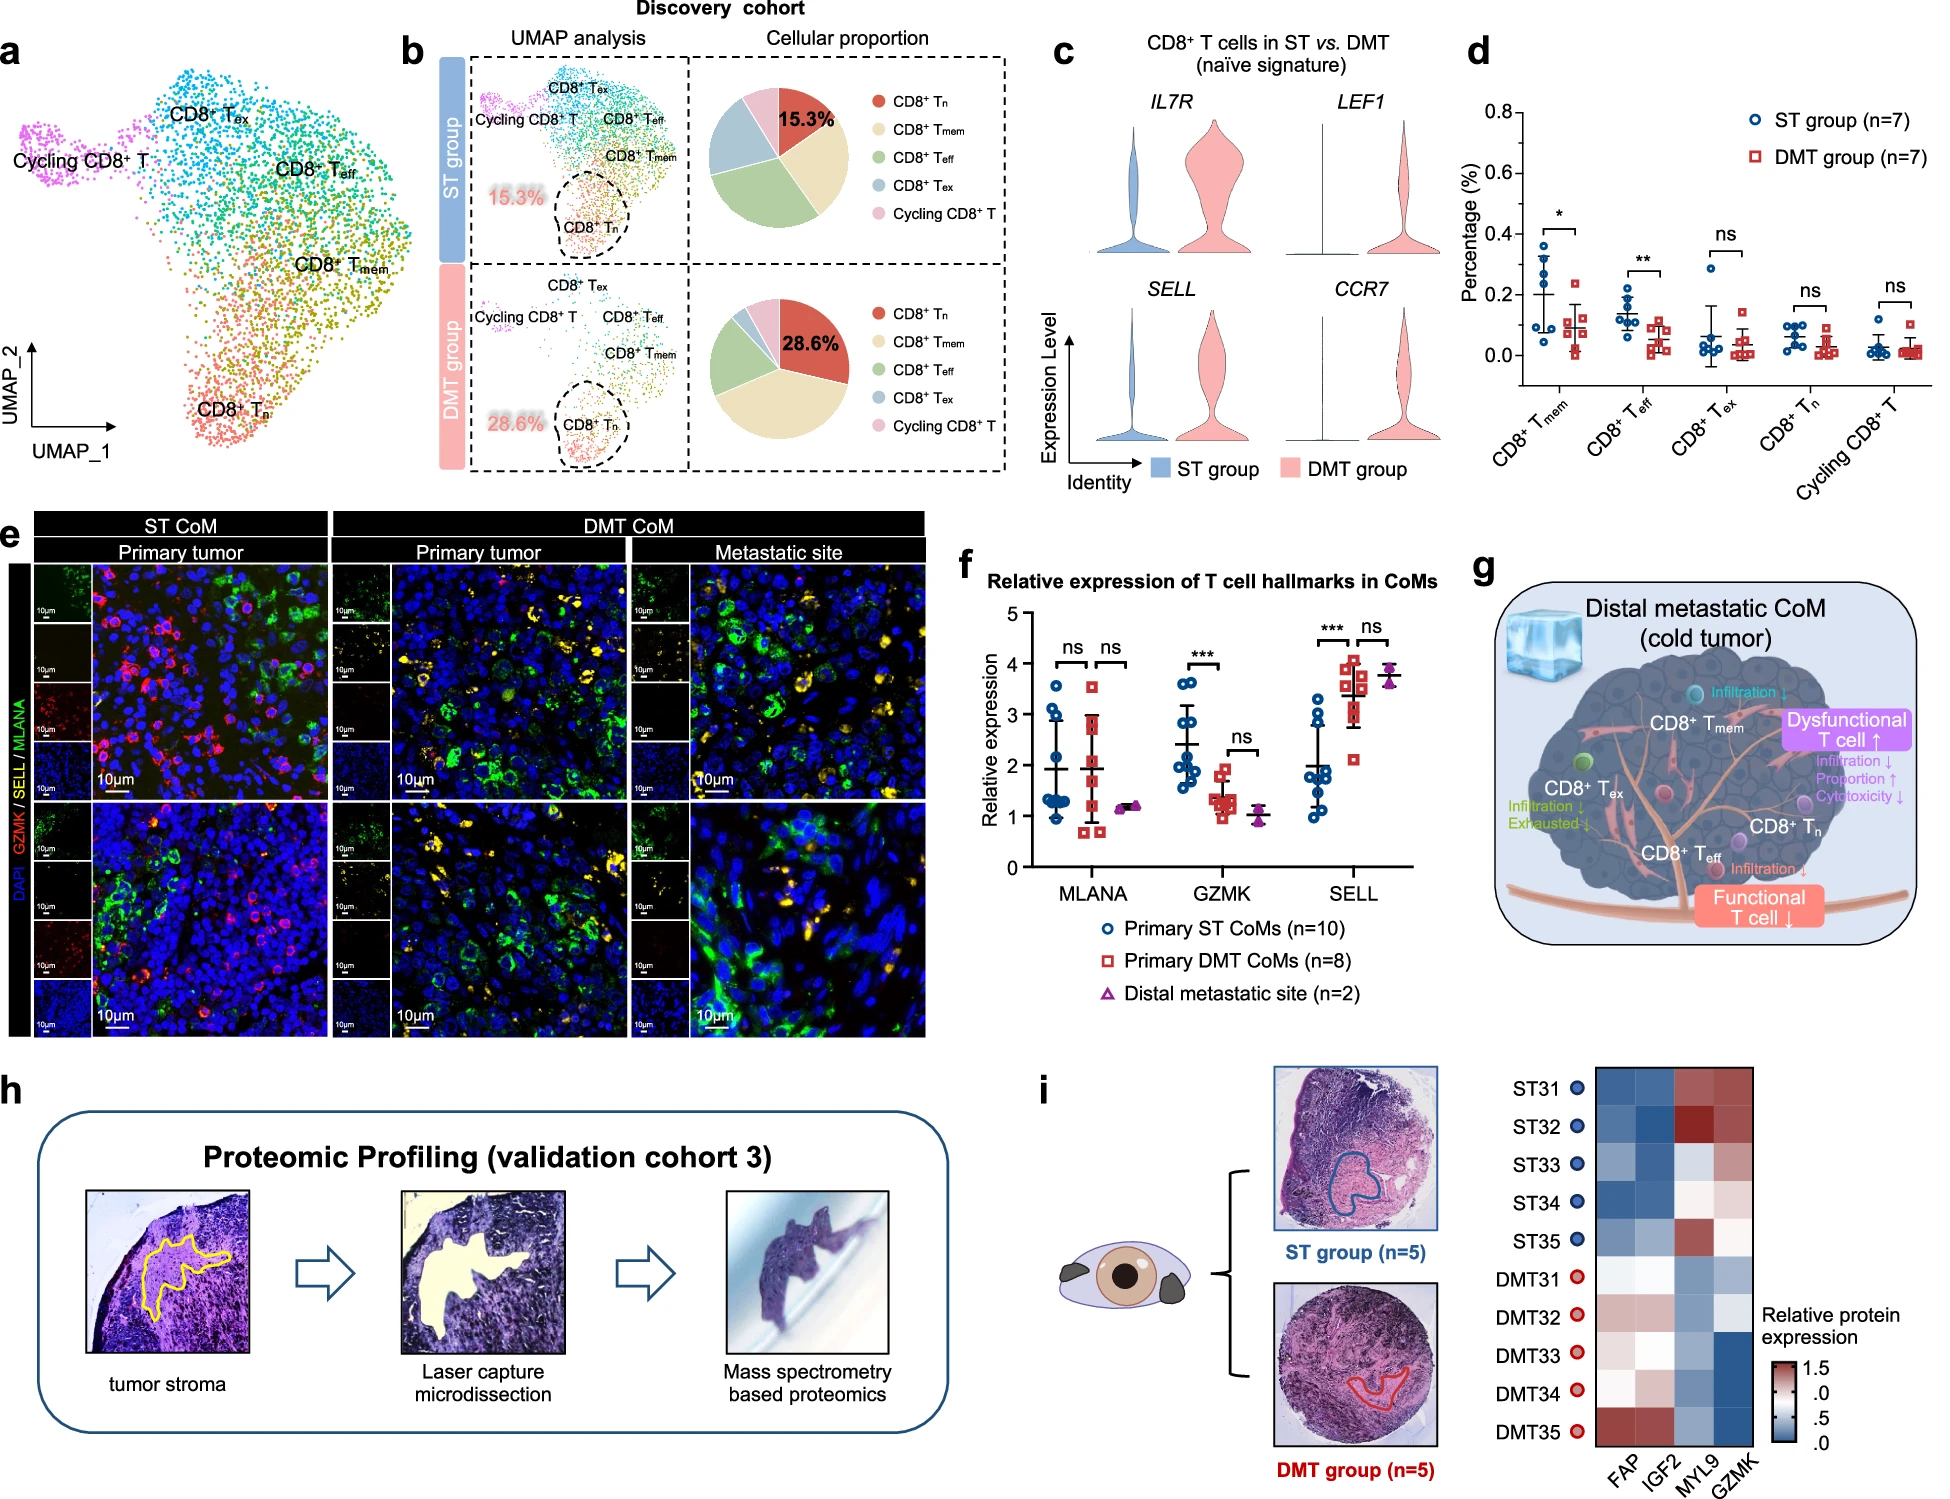
a UMAP plot showing the CD8+ T cell subsets from all 7 CoM samples, labeled in different colors. b The proportions of specific subsets of CD8+ T cells between the ST group and DMT group were analyzed (left). Pie charts showing the proportion of CD8+ Tn cells in ST and DMT groups (right). c Violin plot indicating the expression of naive signature of CD8+ T cells in ST and DMT groups. d The infiltration percentage of specific subsets of CD8+ T cells between the ST group (n = 7) and DMT group (n = 7) in both discovery cohort and validation cohort 1 was analyzed. Two-tailed unpaired Student’s t-test. e IF staining validating the characteristics of immune microenvironment in ST and DMT samples. Distal metastatic sites from DMT CoM patients were included in DMT group. The representative images were displayed (ST group: primary CoM tissues, n = 2, left; DMT group: primary CoM tissues, n = 2, middle; distal metastatic lesions, n = 2, right). Scale bars, 10 μm. f Relative expression of MLANA, GZMK, and SELL in primary ST CoMs, primary DMT CoMs, and distal metastatic sites according to the results of IF staining (One-way ANOVA). g Schematic diagram showing changes of CD8+ T cells in distant metastatic CoM. h FFPE tissue was sectioned and stained with hematoxylin and eosin (H&E) to identify histomorphological features. Tissues were then excised using LCM and prepared for LC-MS/MS-based proteomics. i Differentially expressed proteins between ST group (n = 5) and DMT group (n = 5), patient of origin is annotated on the left.
