
Fig. 1: Spatial-ATAC-seq design, workflow and data quality.
From: Spatial profiling of chromatin accessibility in mouse and human tissues
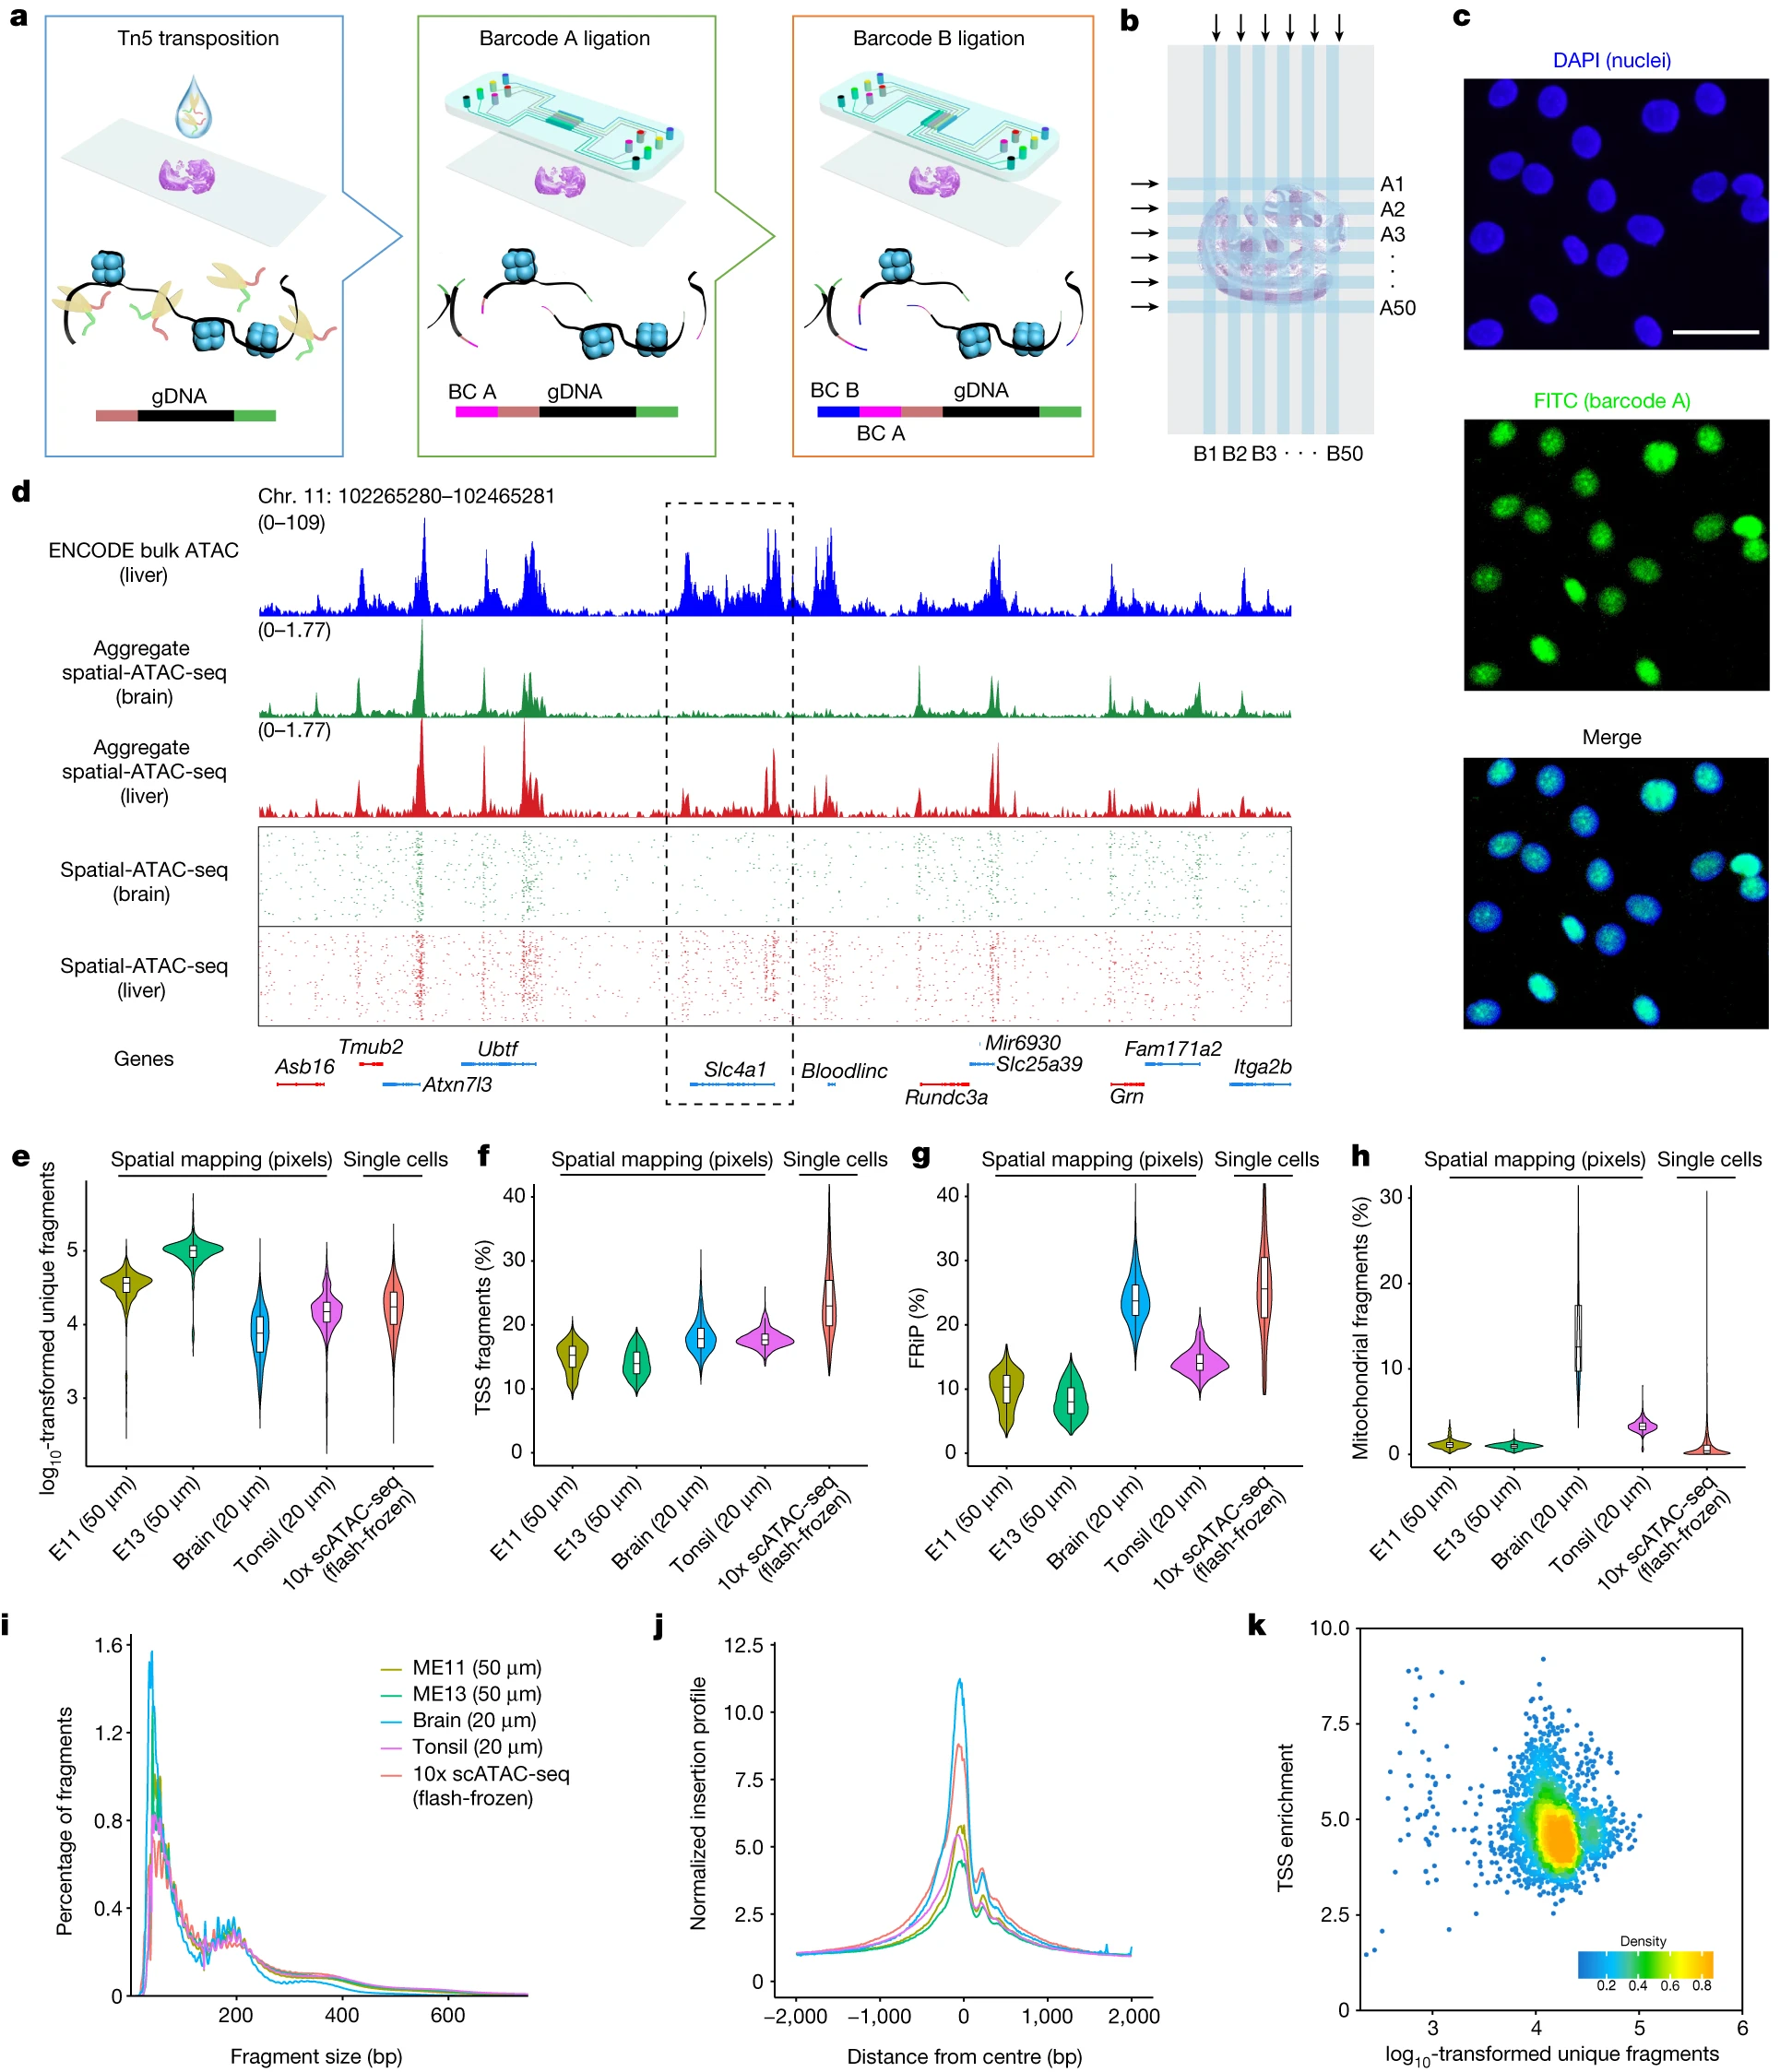
a, Schematic workflow. Tn5 transposition was performed in tissue sections, followed by in situ ligation of two sets of DNA barcodes (A1–A50, B1–B50). b, Microfluidic crossflow scheme. c, Validation of in situ transposition and ligation using fluorescent DNA probes. Tn5 transposition was performed in 3T3 cells on a glass slide stained with DAPI (blue). Next, FITC-labelled barcode A was ligated to the adapters on the transposase-accessible genomic DNA. Scale bar, 50 µm. d, Aggregate spatial chromatin accessibility profiles recapitulated published profiles of ATAC-seq in the liver of E13 mouse embryos. e, Comparison of the number of unique fragments between spatial-ATAC-seq and 10x scATAC-seq. f, Comparison of the fraction of TSS fragments between spatial-ATAC-seq and 10x scATAC-seq. g, Comparison of the fraction of mitochondrial fragments between spatial-ATAC-seq and 10x scATAC-seq. h, Comparison of the fraction of reads in peaks (FRiP) between spatial-ATAC-seq and 10x scATAC-seq. The number of pixels/cells in E11: 2,162; E13: 2,275; brain: 2,500; tonsil: 2,488; scATAC-seq: 3,789. The box plots show the median (centre line), the first and third quartiles (box limits), and 1.5× the interquartile range (whiskers). i, Comparison of the insert size distribution of ATAC-seq fragments between spatial-ATAC-seq and 10x scATAC-seq. j, Comparison of the enrichment of ATAC-seq reads around TSSs between spatial-ATAC-seq and 10x scATAC-seq. Colouring is consistent with i. k, The TSS enrichment score versus unique nuclear fragments per cell in human tonsils.
