
Fig. 2: Spatial chromatin accessibility mapping of E13 mouse embryos.
From: Spatial profiling of chromatin accessibility in mouse and human tissues
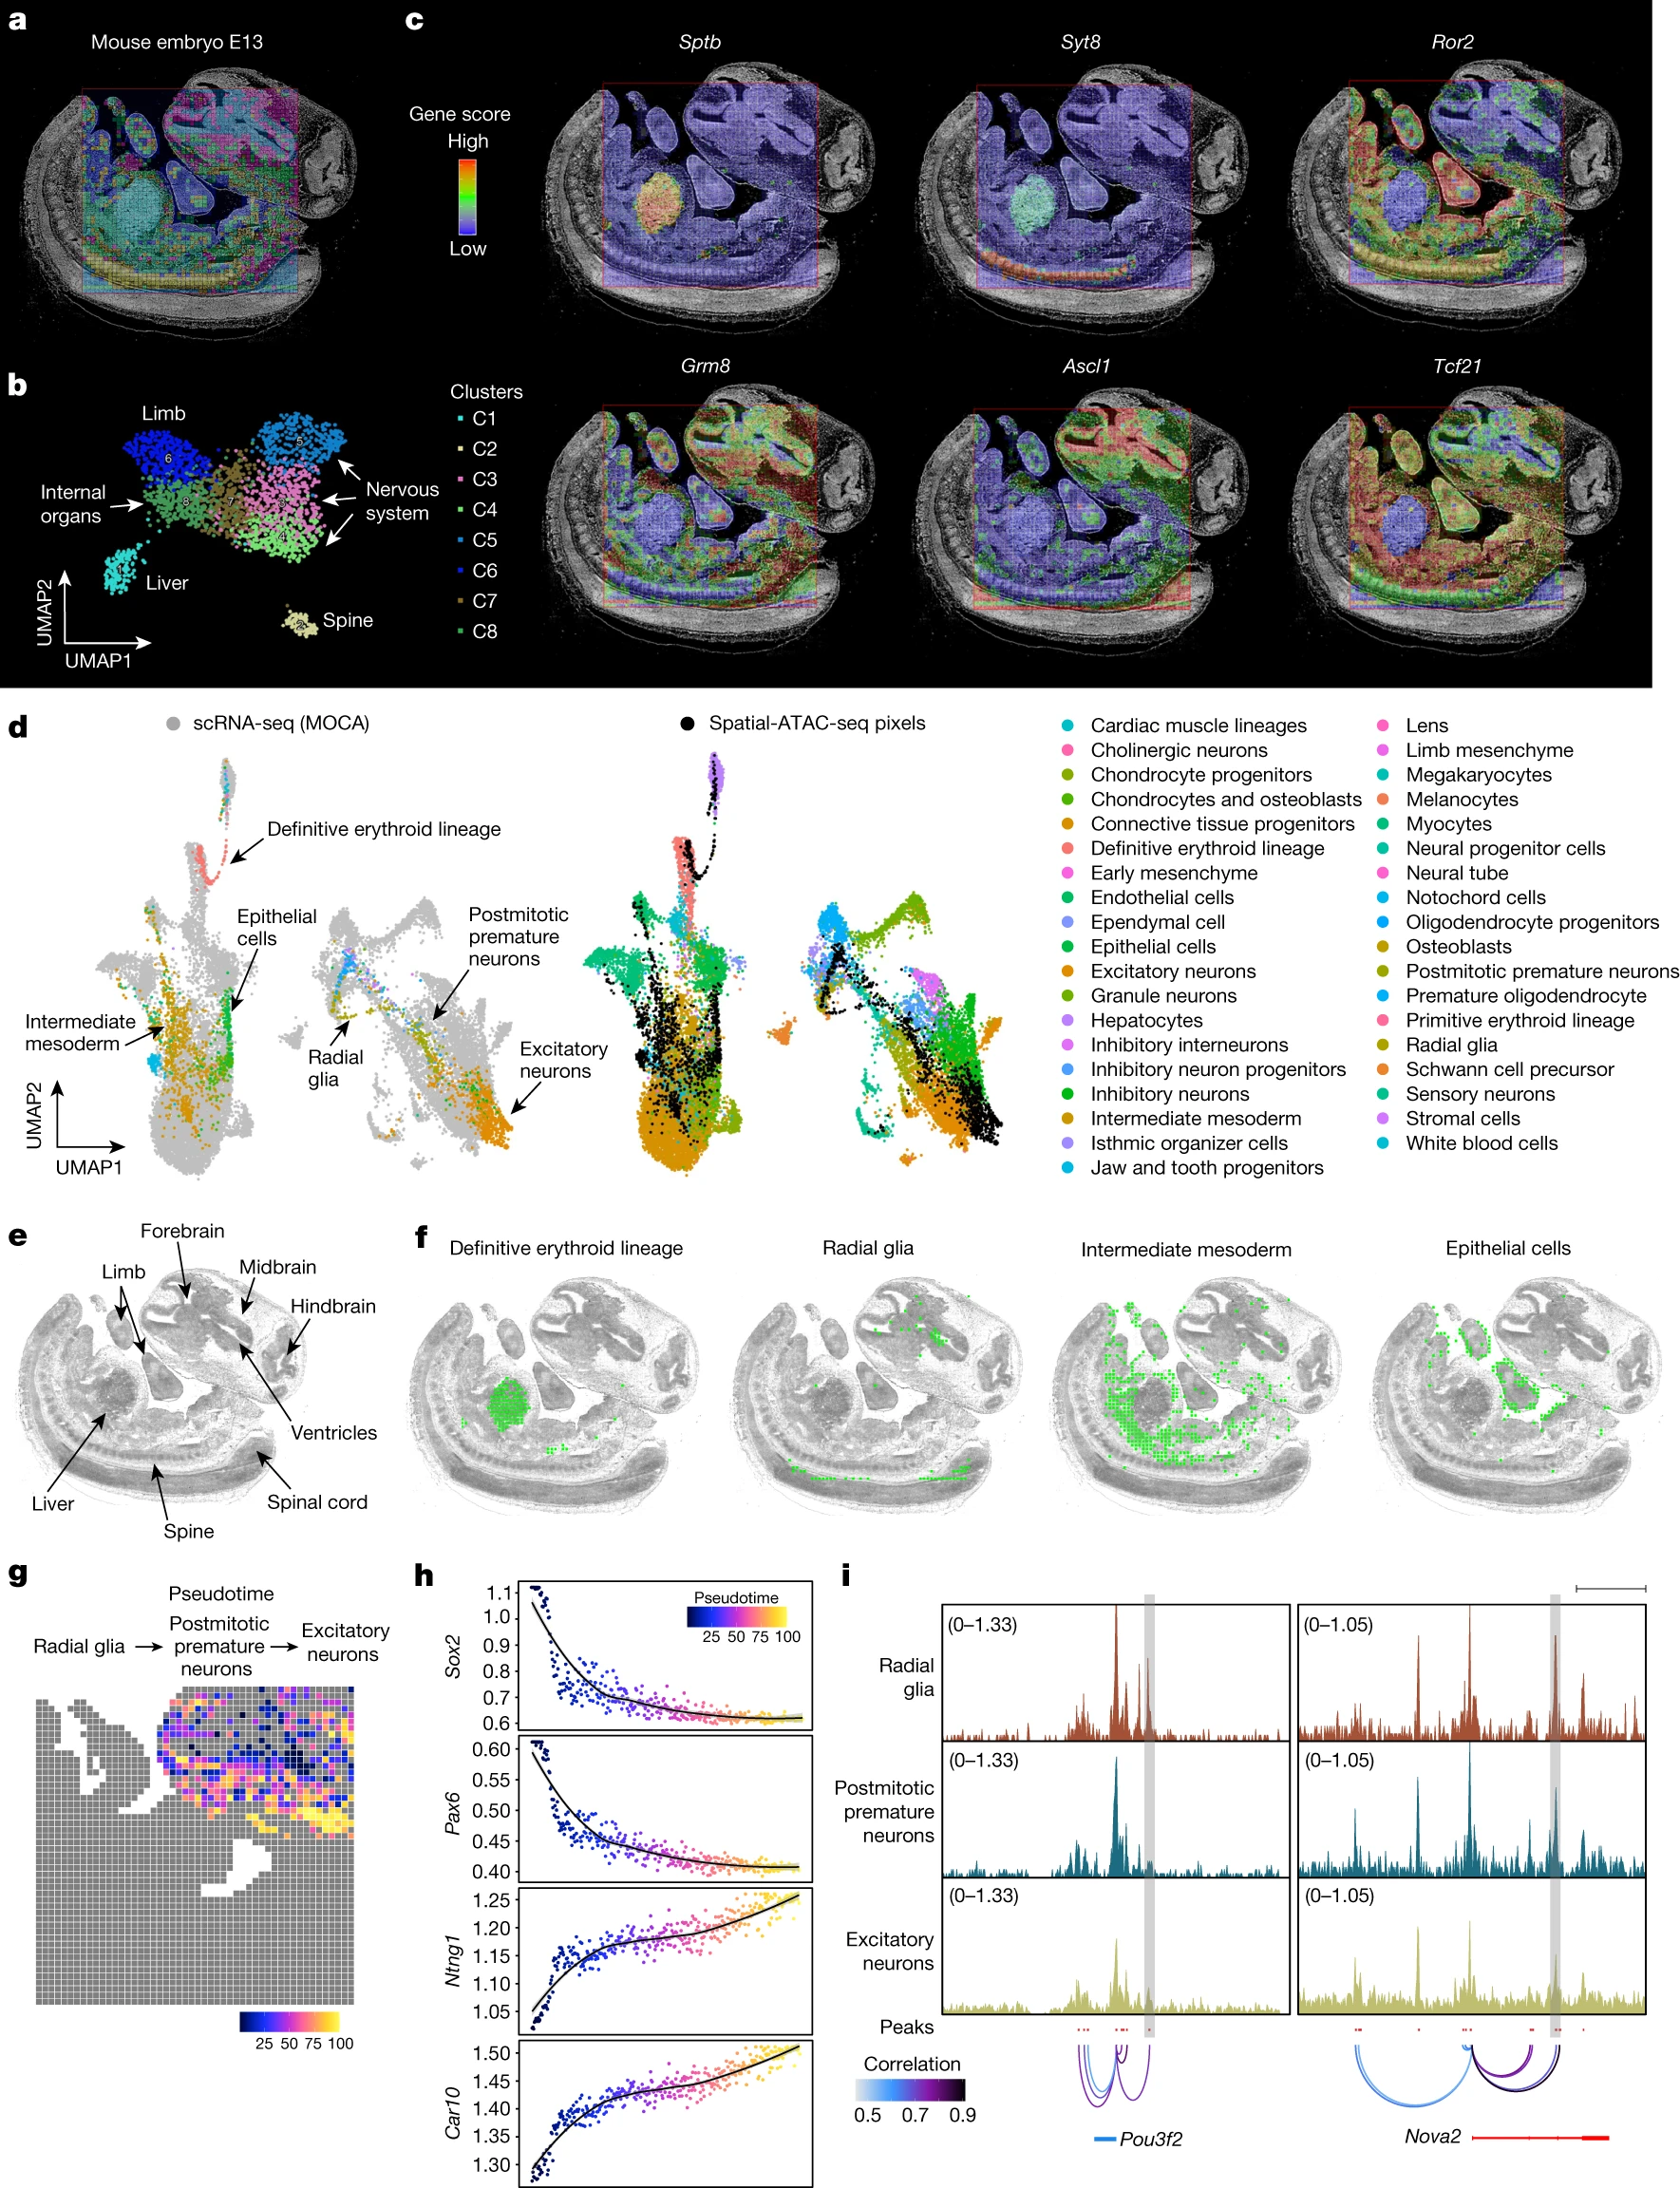
a, An unbiased clustering analysis was performed on the basis of the chromatin accessibility of all tissue pixels (50 μm pixel size). An overlay of clusters with the tissue image reveals that the spatial chromatin accessibility clusters precisely match the anatomical regions. For better visualization, we scaled the size of the pixels. b, UMAP embedding of the unsupervised clustering analysis for chromatin accessibility. Cluster identities and colouring of clusters are consistent with a. c, The spatial mapping of gene scores for selected marker genes in different clusters and the chromatin accessibility at selected genes are highly tissue specific. d, Integration of scRNA-seq from E13.5 mouse embryos20 and spatial-ATAC-seq data. Unsupervised clustering of the combined data was coloured by different cell types. MOCA, Mouse Organogenesis Cell Atlas. e, Anatomical annotation of major tissue regions based on the haematoxylin and eosin (H&E)-stained image. f, Spatial mapping of selected cell types identified by label transferring from scRNA-seq to spatial-ATAC-seq data. g, Pseudotemporal reconstruction from the developmental process from radial glia, postmitotic premature neurons, to excitatory neurons plotted in space. h, The dynamics of the gene scores of selected genes along the pseudotime shown in g. i, The dynamics of the chromatin accessibility of individual regulatory elements at Pou3f2 and Nova2 (highlighted in grey boxes). Scale bar, 20 kb.
