
Fig. 3: Spatial chromatin accessibility mapping and integrative analysis of P21 mouse brain with a 20 µm pixel size.
From: Spatial profiling of chromatin accessibility in mouse and human tissues
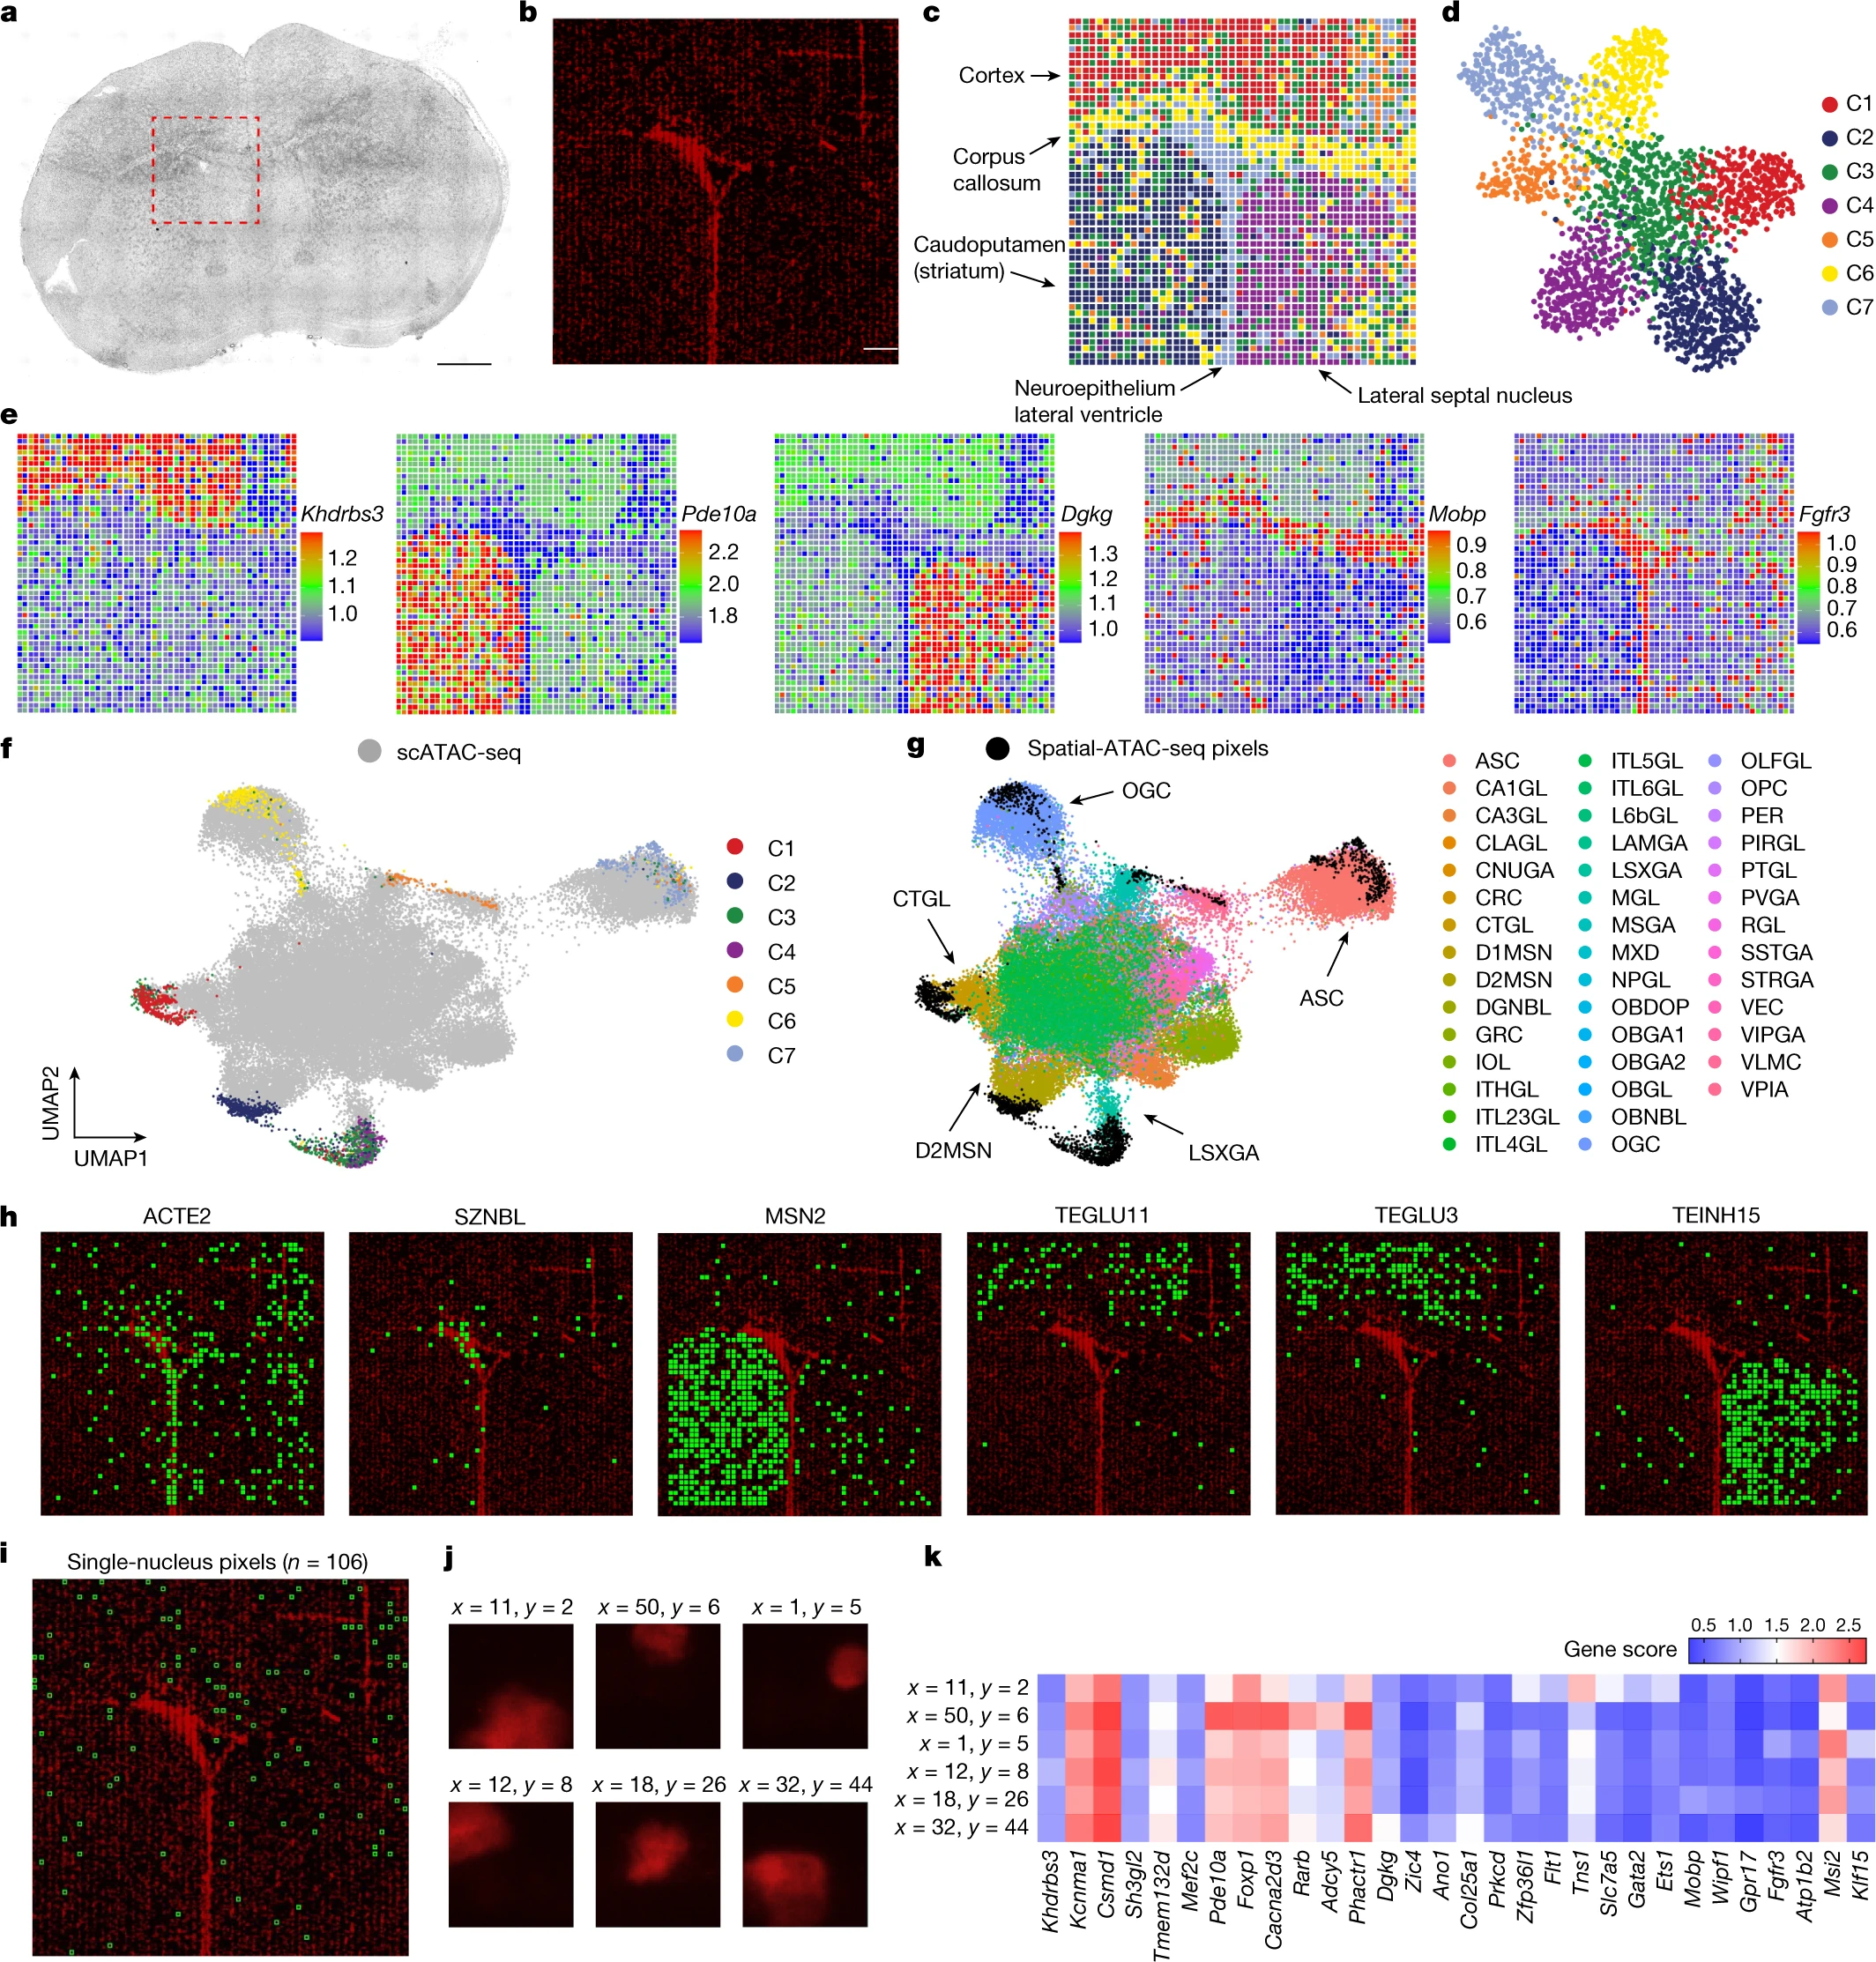
a, Bright-field image of a mouse brain tissue section and the region of interest for mapping (red dashed box). Scale bar, 1 mm. b, Fluorescence image of nuclear staining with 7-AAD in the region of interest for spatial-ATAC-seq mapping. Scale bar, 200 µm. c,d, Unsupervised clustering analysis (c) and the spatial distribution (d) of each cluster in the mouse brain. For better visualization, we scaled the size of the pixels. e, Spatial mapping of gene scores for selected marker genes in different clusters. f,g, Integration of scATAC-seq from mouse brains29 (f) and spatial-ATAC-seq (g). h, Spatial mapping of selected cell types identified by label transfer from scRNA-seq to spatial-ATAC-seq. i, The spatial location of pixels containing a single nucleus. j, Fluorescence images of selected pixels containing a single nucleus. k, Heat map of the gene scores of selected pixels containing a single nucleus. A list of abbreviation definitions can be found in Supplementary Table 2.
