
Fig. 4: Spatial chromatin accessibility mapping of a human tonsil with a 20 µm pixel size.
From: Spatial profiling of chromatin accessibility in mouse and human tissues
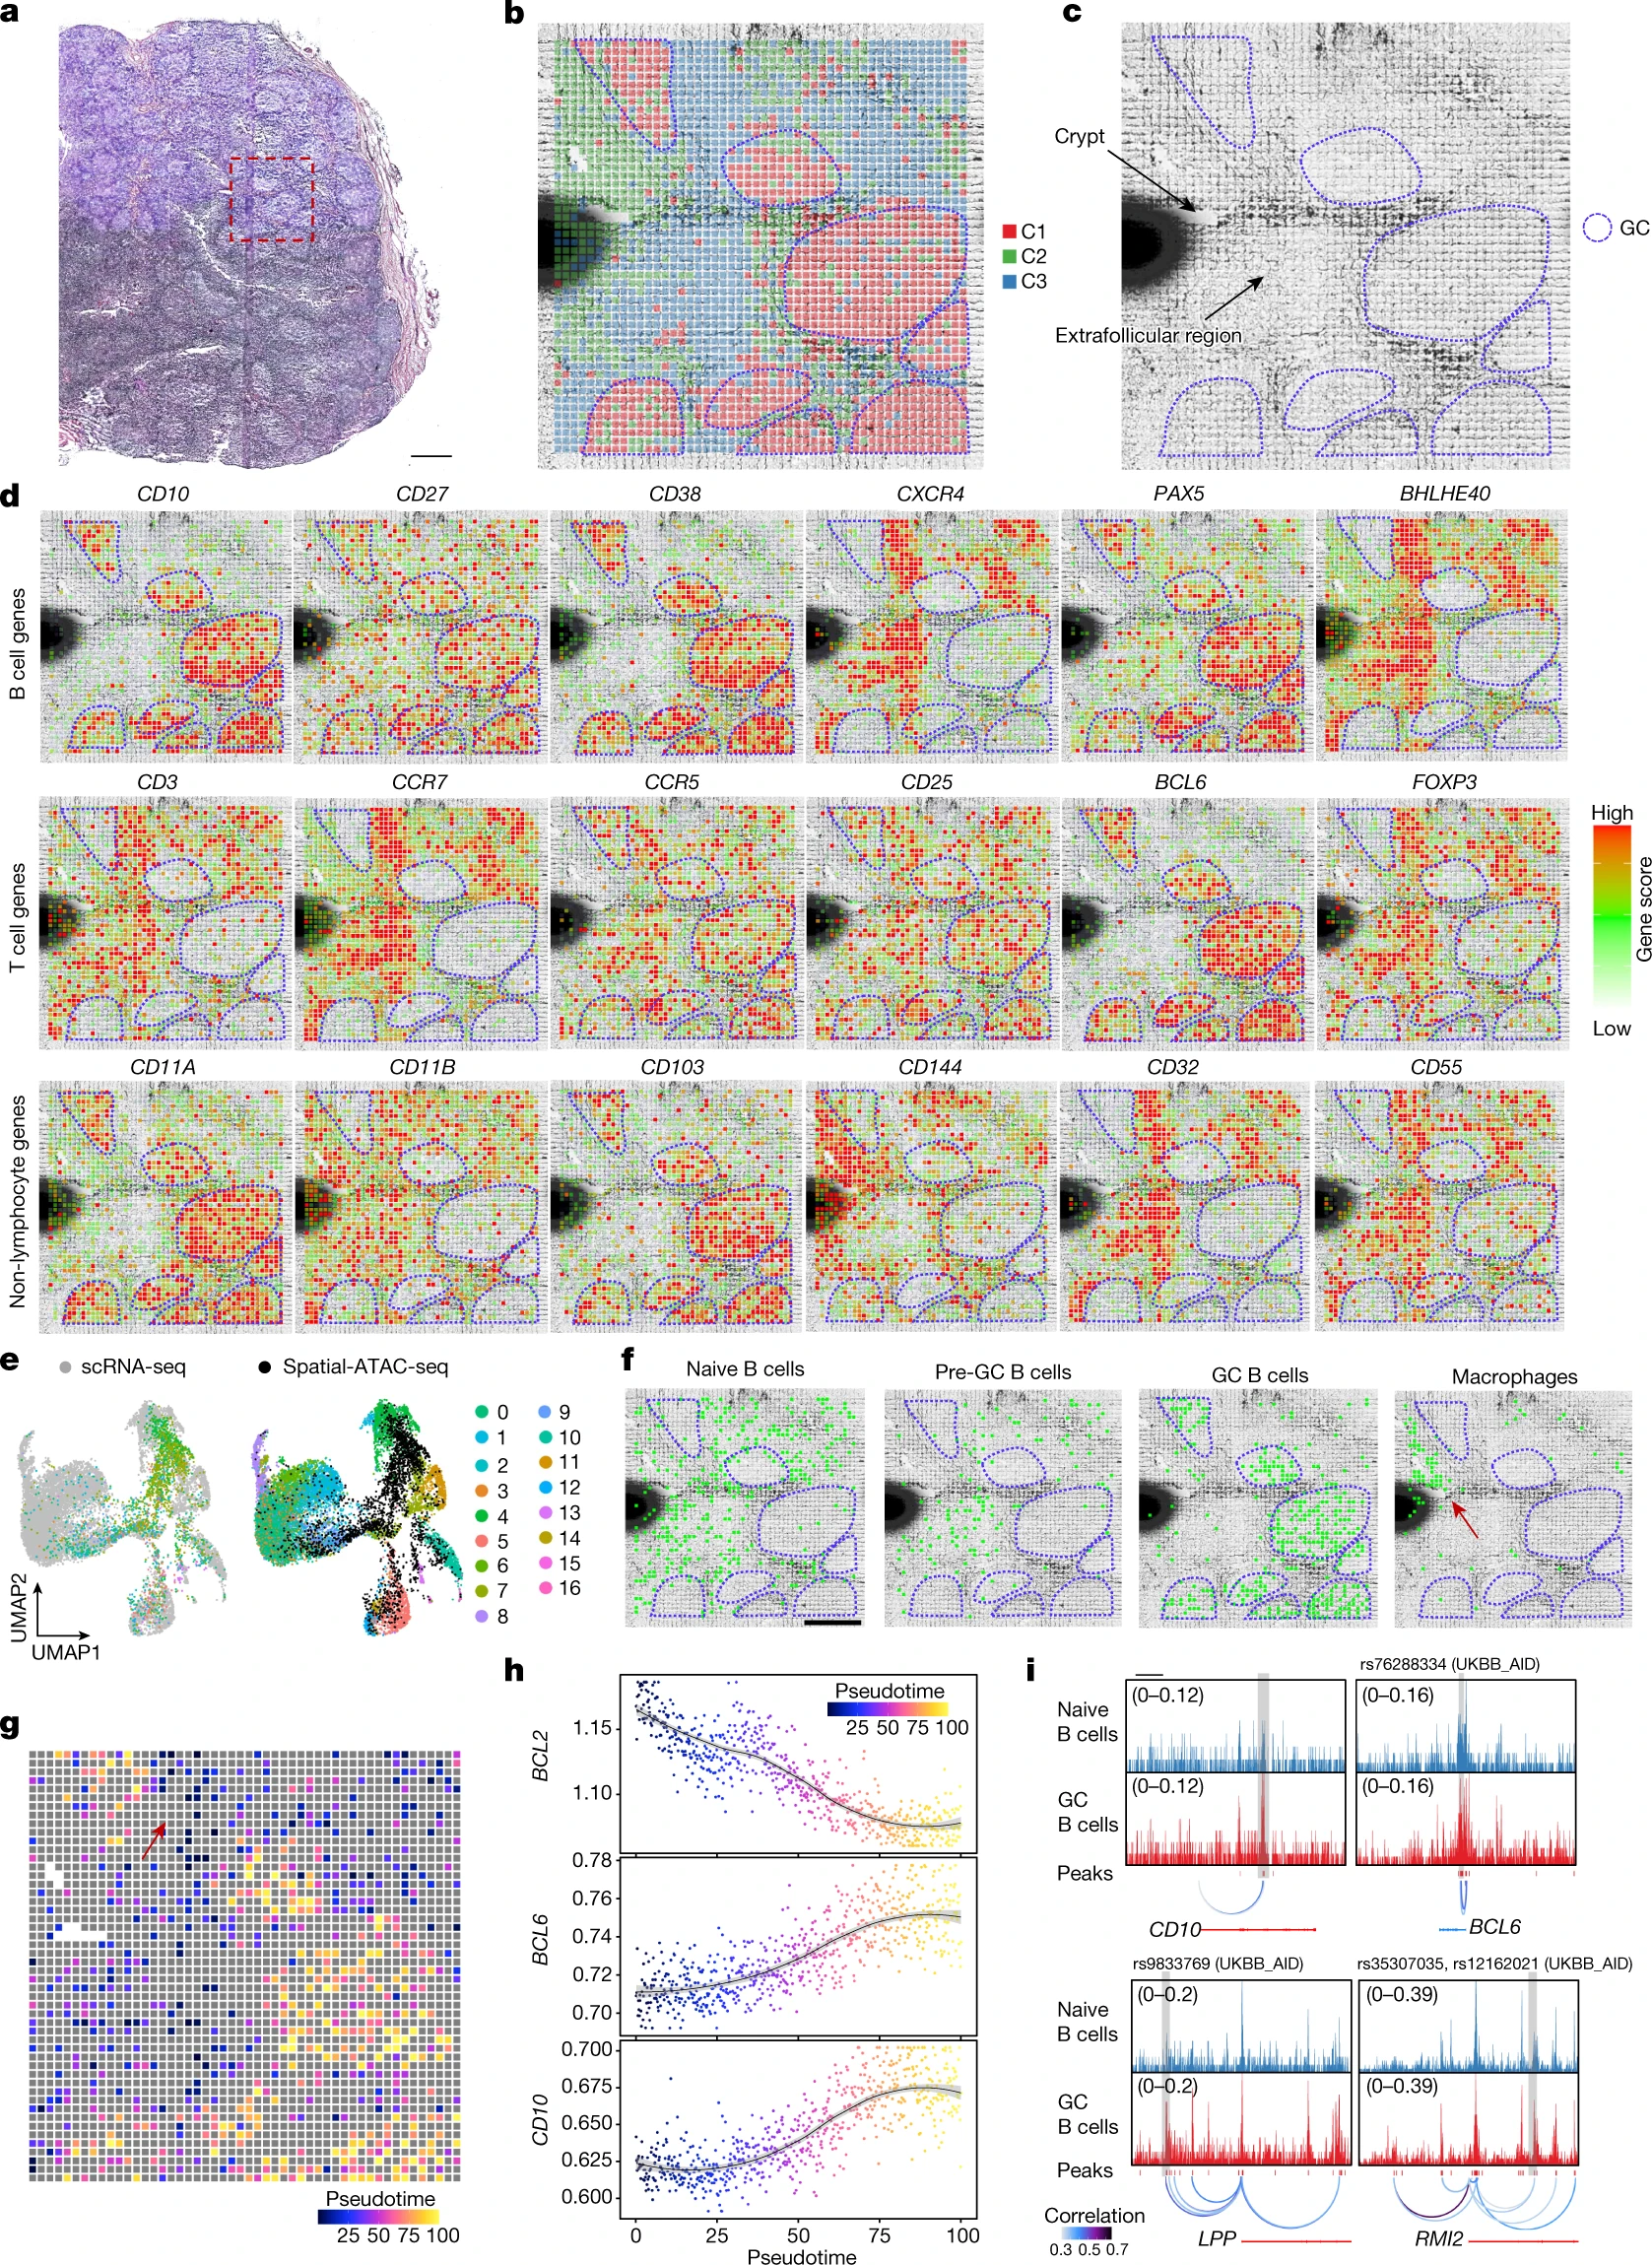
a, H&E image of a human tonsil from an adjacent tissue section and a region of interest for spatial chromatin accessibility mapping. Scale bar, 1 mm. b, Unsupervised clustering analysis and spatial distribution of each cluster. For better visualization, we scaled the size of the pixels. c, Anatomical annotation of major tonsillar regions. d, Spatial mapping of the gene scores for selected genes. e, Integration of scRNA-seq data48 and spatial-ATAC-seq data. Unsupervised clustering of the combined data was coloured by different cell types. f, Spatial mapping of selected cell types identified by label transferring from scRNA-seq to spatial-ATAC-seq data. Scale bar, 500 µm. g, Pseudotemporal reconstruction from the developmental process from naive B cells to GC B cells plotted in space. h, Dynamics of the gene scores of selected genes along the pseudotime shown in g. i, Dynamics of the chromatin accessibility of individual regulatory elements along pseudotime (highlighted in grey boxes). Fine-mapped autoimmune-associated GWAS variants and high-resolution individual single-nucleotide polymorphism loci localizing to accessible chromatin are shown. Scale bar, 25 kb.
