
Extended Data Fig. 2: The distribution of mtDNA and Y-chromosome haplogroups among different hunter-gatherer groups.
From: Palaeogenomics of Upper Palaeolithic to Neolithic European hunter-gatherers
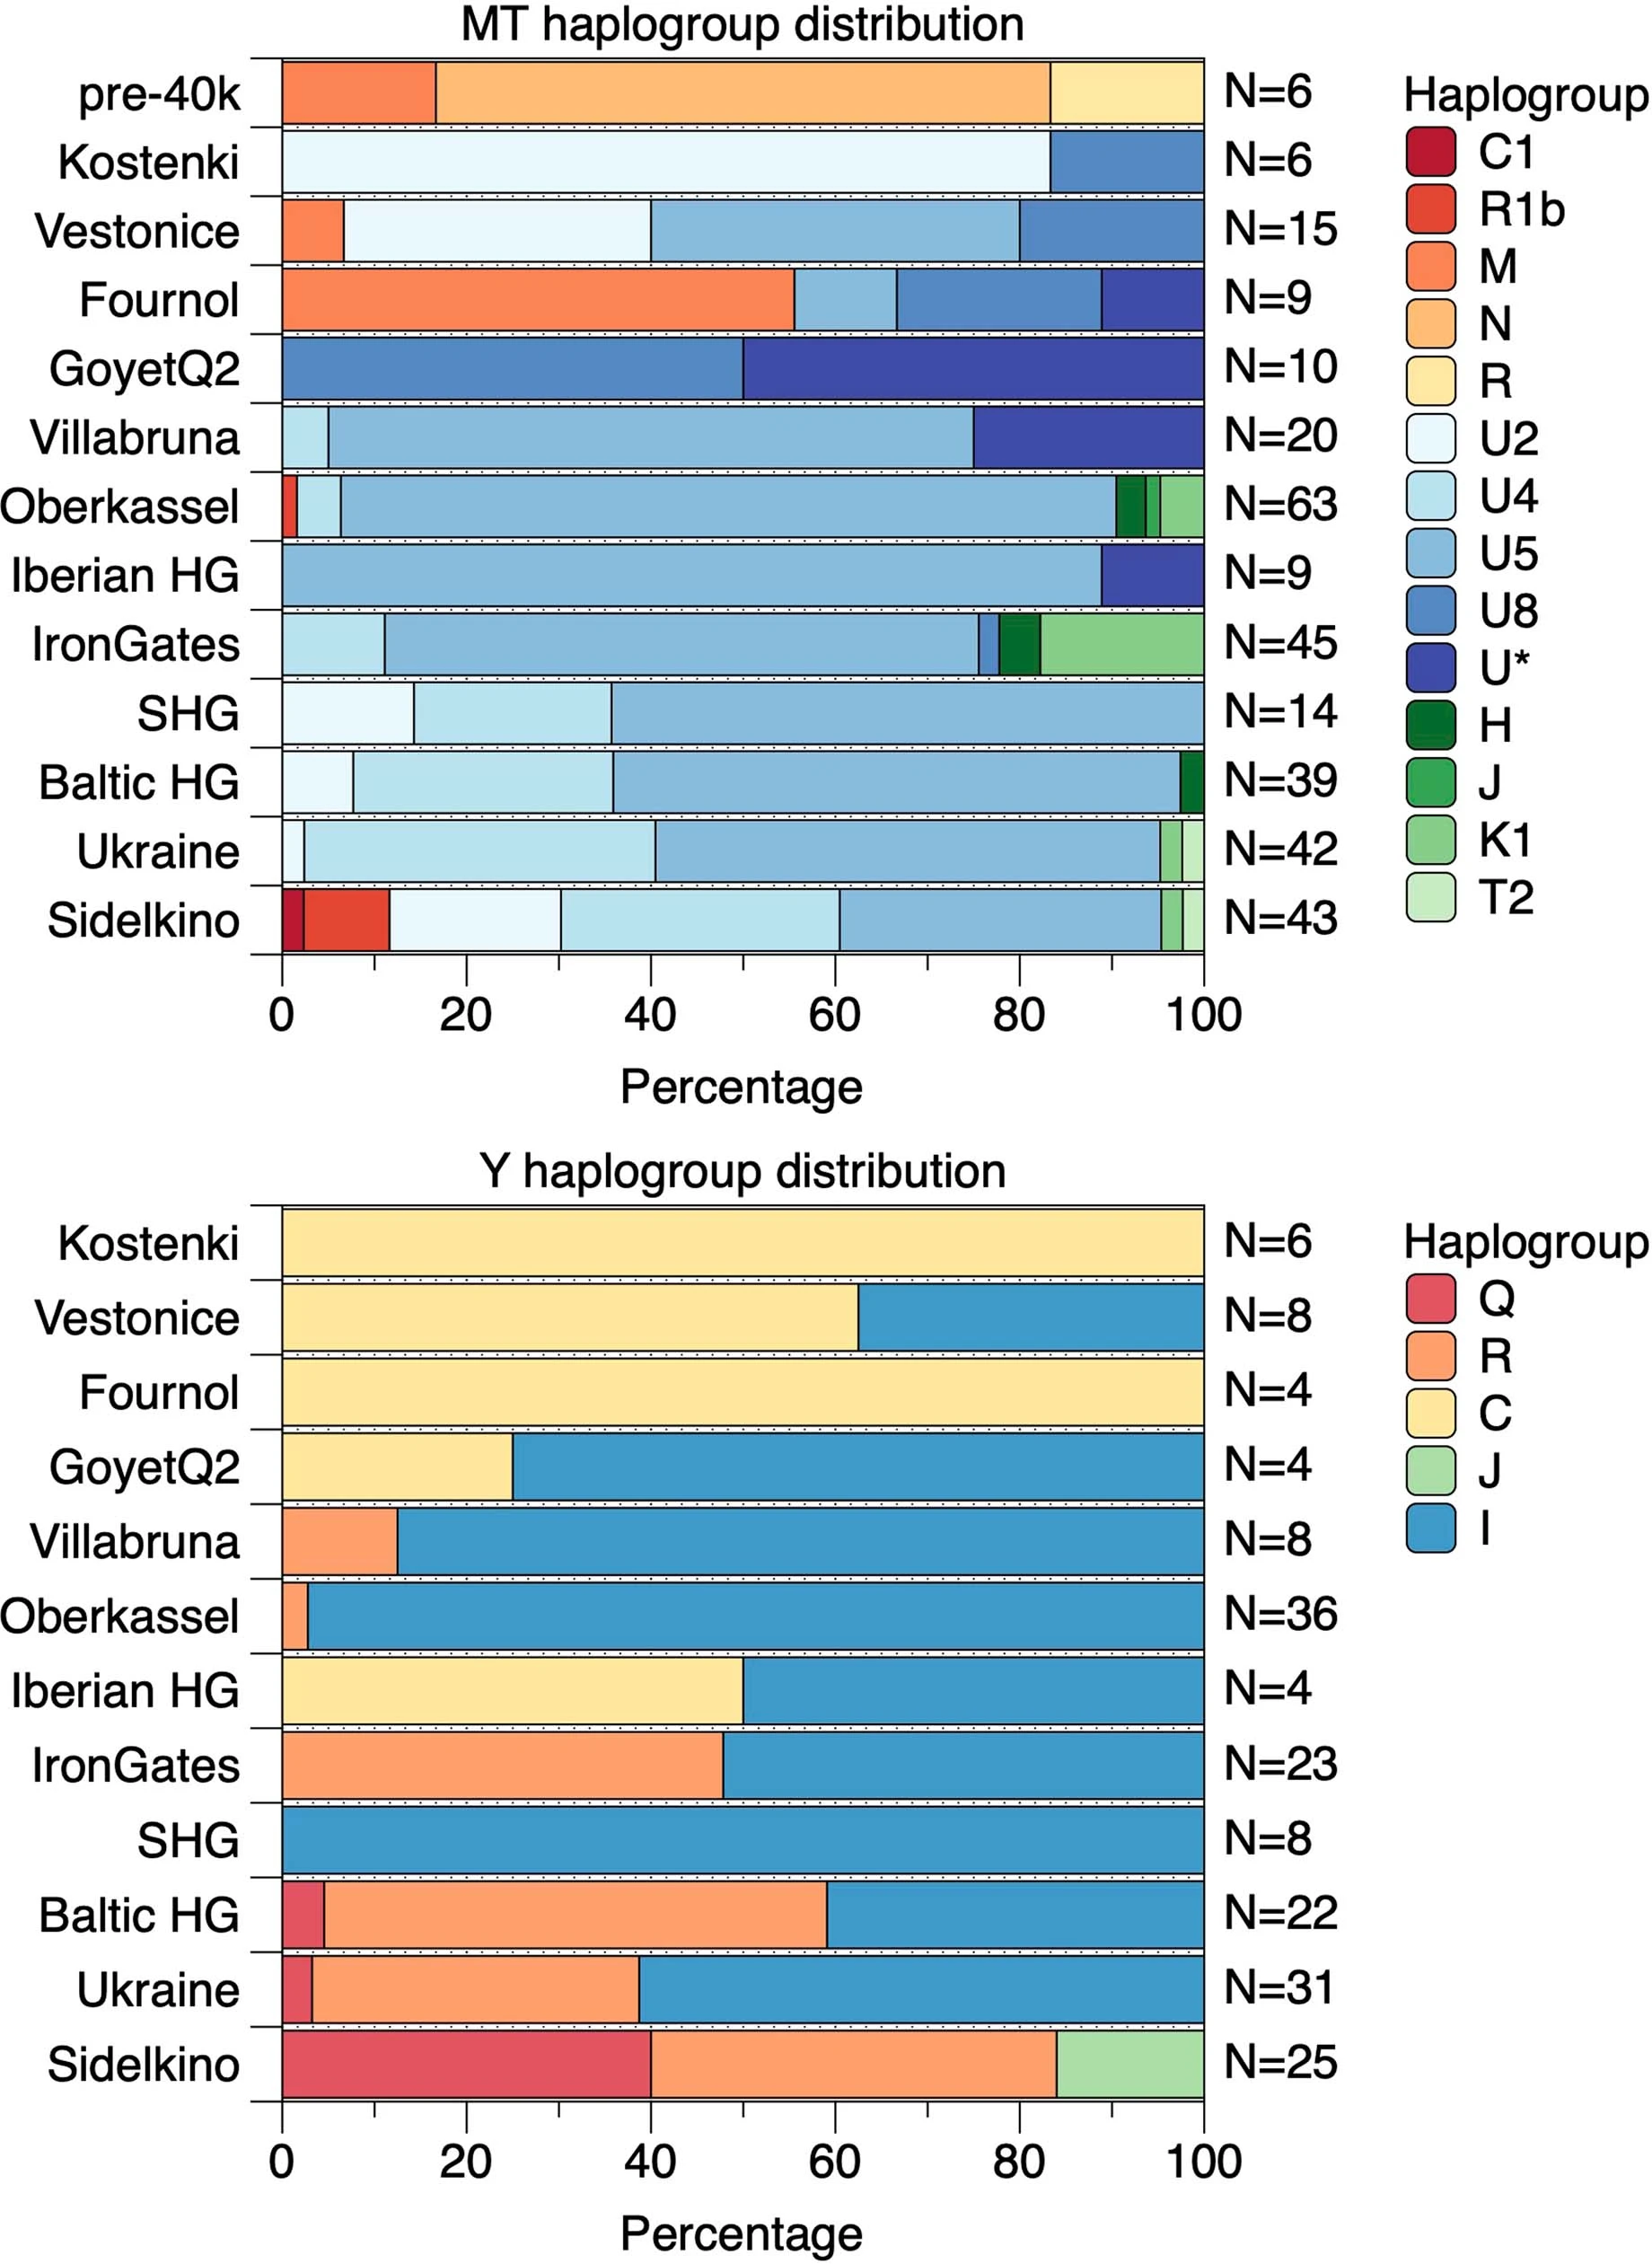
The length of each coloured bar represents the fraction of individuals carrying the corresponding haplogroup (legend on the right of each panel). The number of individuals in each group is written to the right of each bar. We only plotted groups with more than two individuals and, for this reason, individuals from the GoyetQ116-1 cluster are included here into the Fournol cluster.
