
Fig. 2: Spatial chromatin accessibility and transcriptome co-profiling of P22 mouse brain.
From: Spatial epigenome–transcriptome co-profiling of mammalian tissues
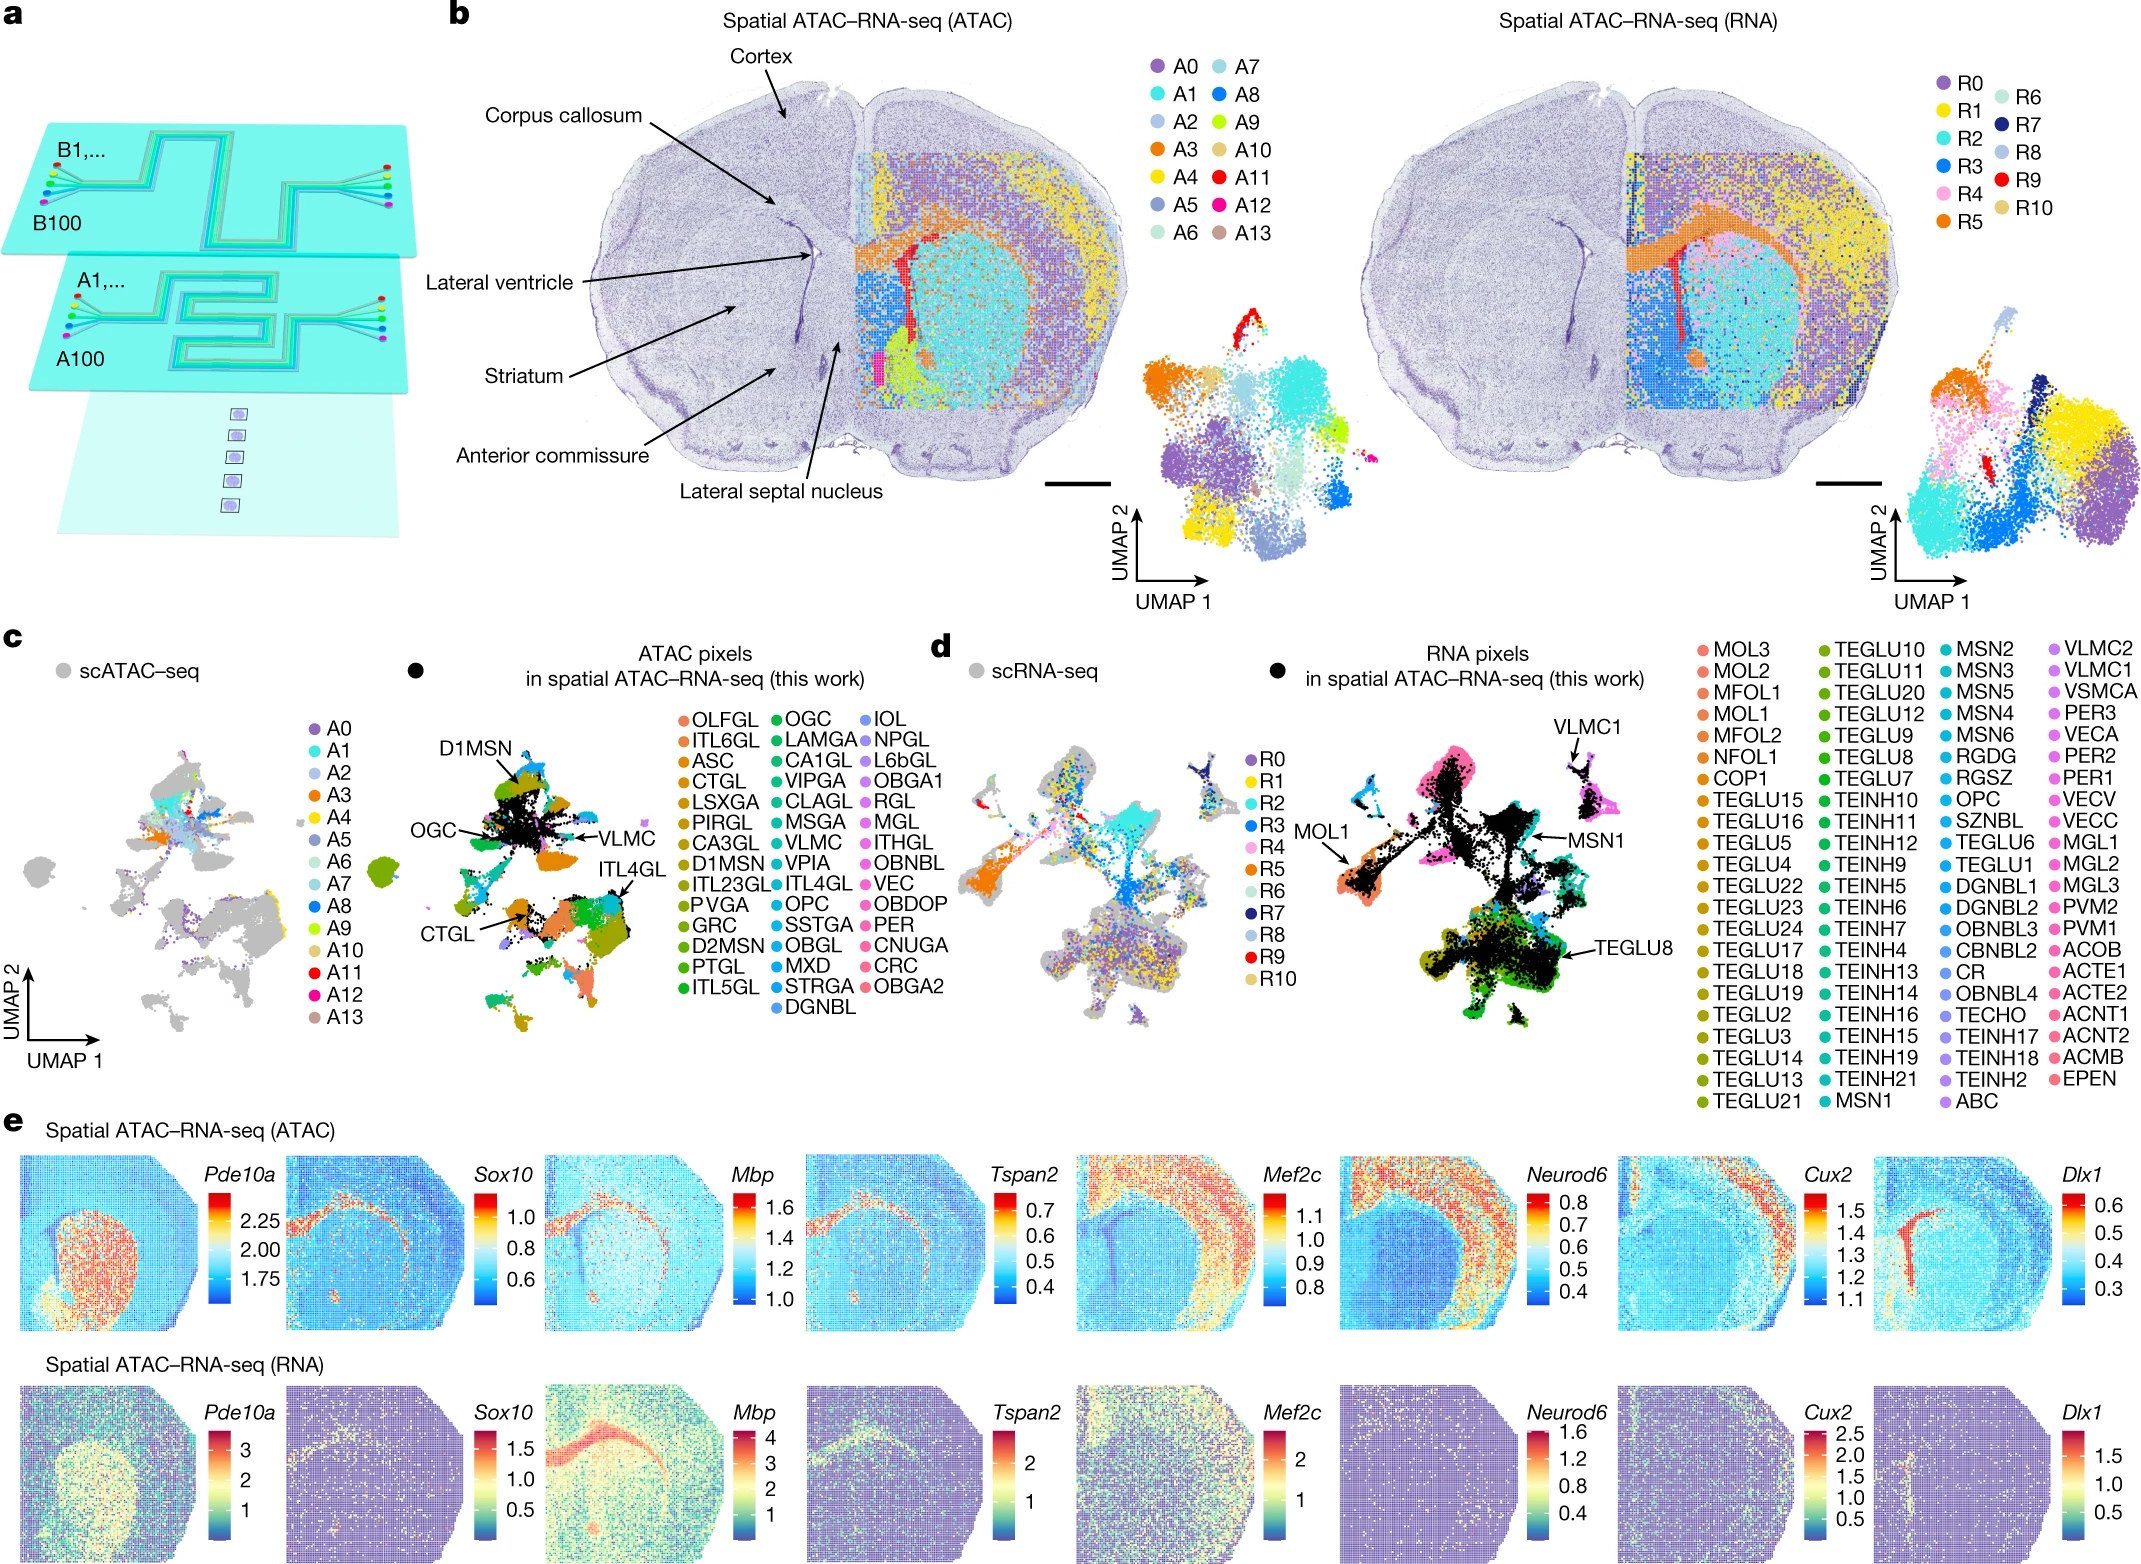
a, Design of microfluidic chips for 100 × 100 barcodes with 20-μm channel size. b, Spatial distribution and UMAP of all clusters for ATAC and RNA in spatial ATAC–RNA-seq of mouse brain. Pixel size, 20 µm; scale bars, 1 mm. c, Integration of ATAC data and scATAC-seq data30 from mouse brain. d, Integration of RNA data and scRNA-seq data32 from mouse brain. e, Spatial mapping of GAS and gene expression for selected marker genes in different clusters for ATAC and RNA in spatial ATAC–RNA-seq. A list of abbreviation definitions can be found in Supplementary Table 1.
