
Fig. 4: Region-specific epigenetic regulation of gene expression.
From: Spatial epigenome–transcriptome co-profiling of mammalian tissues
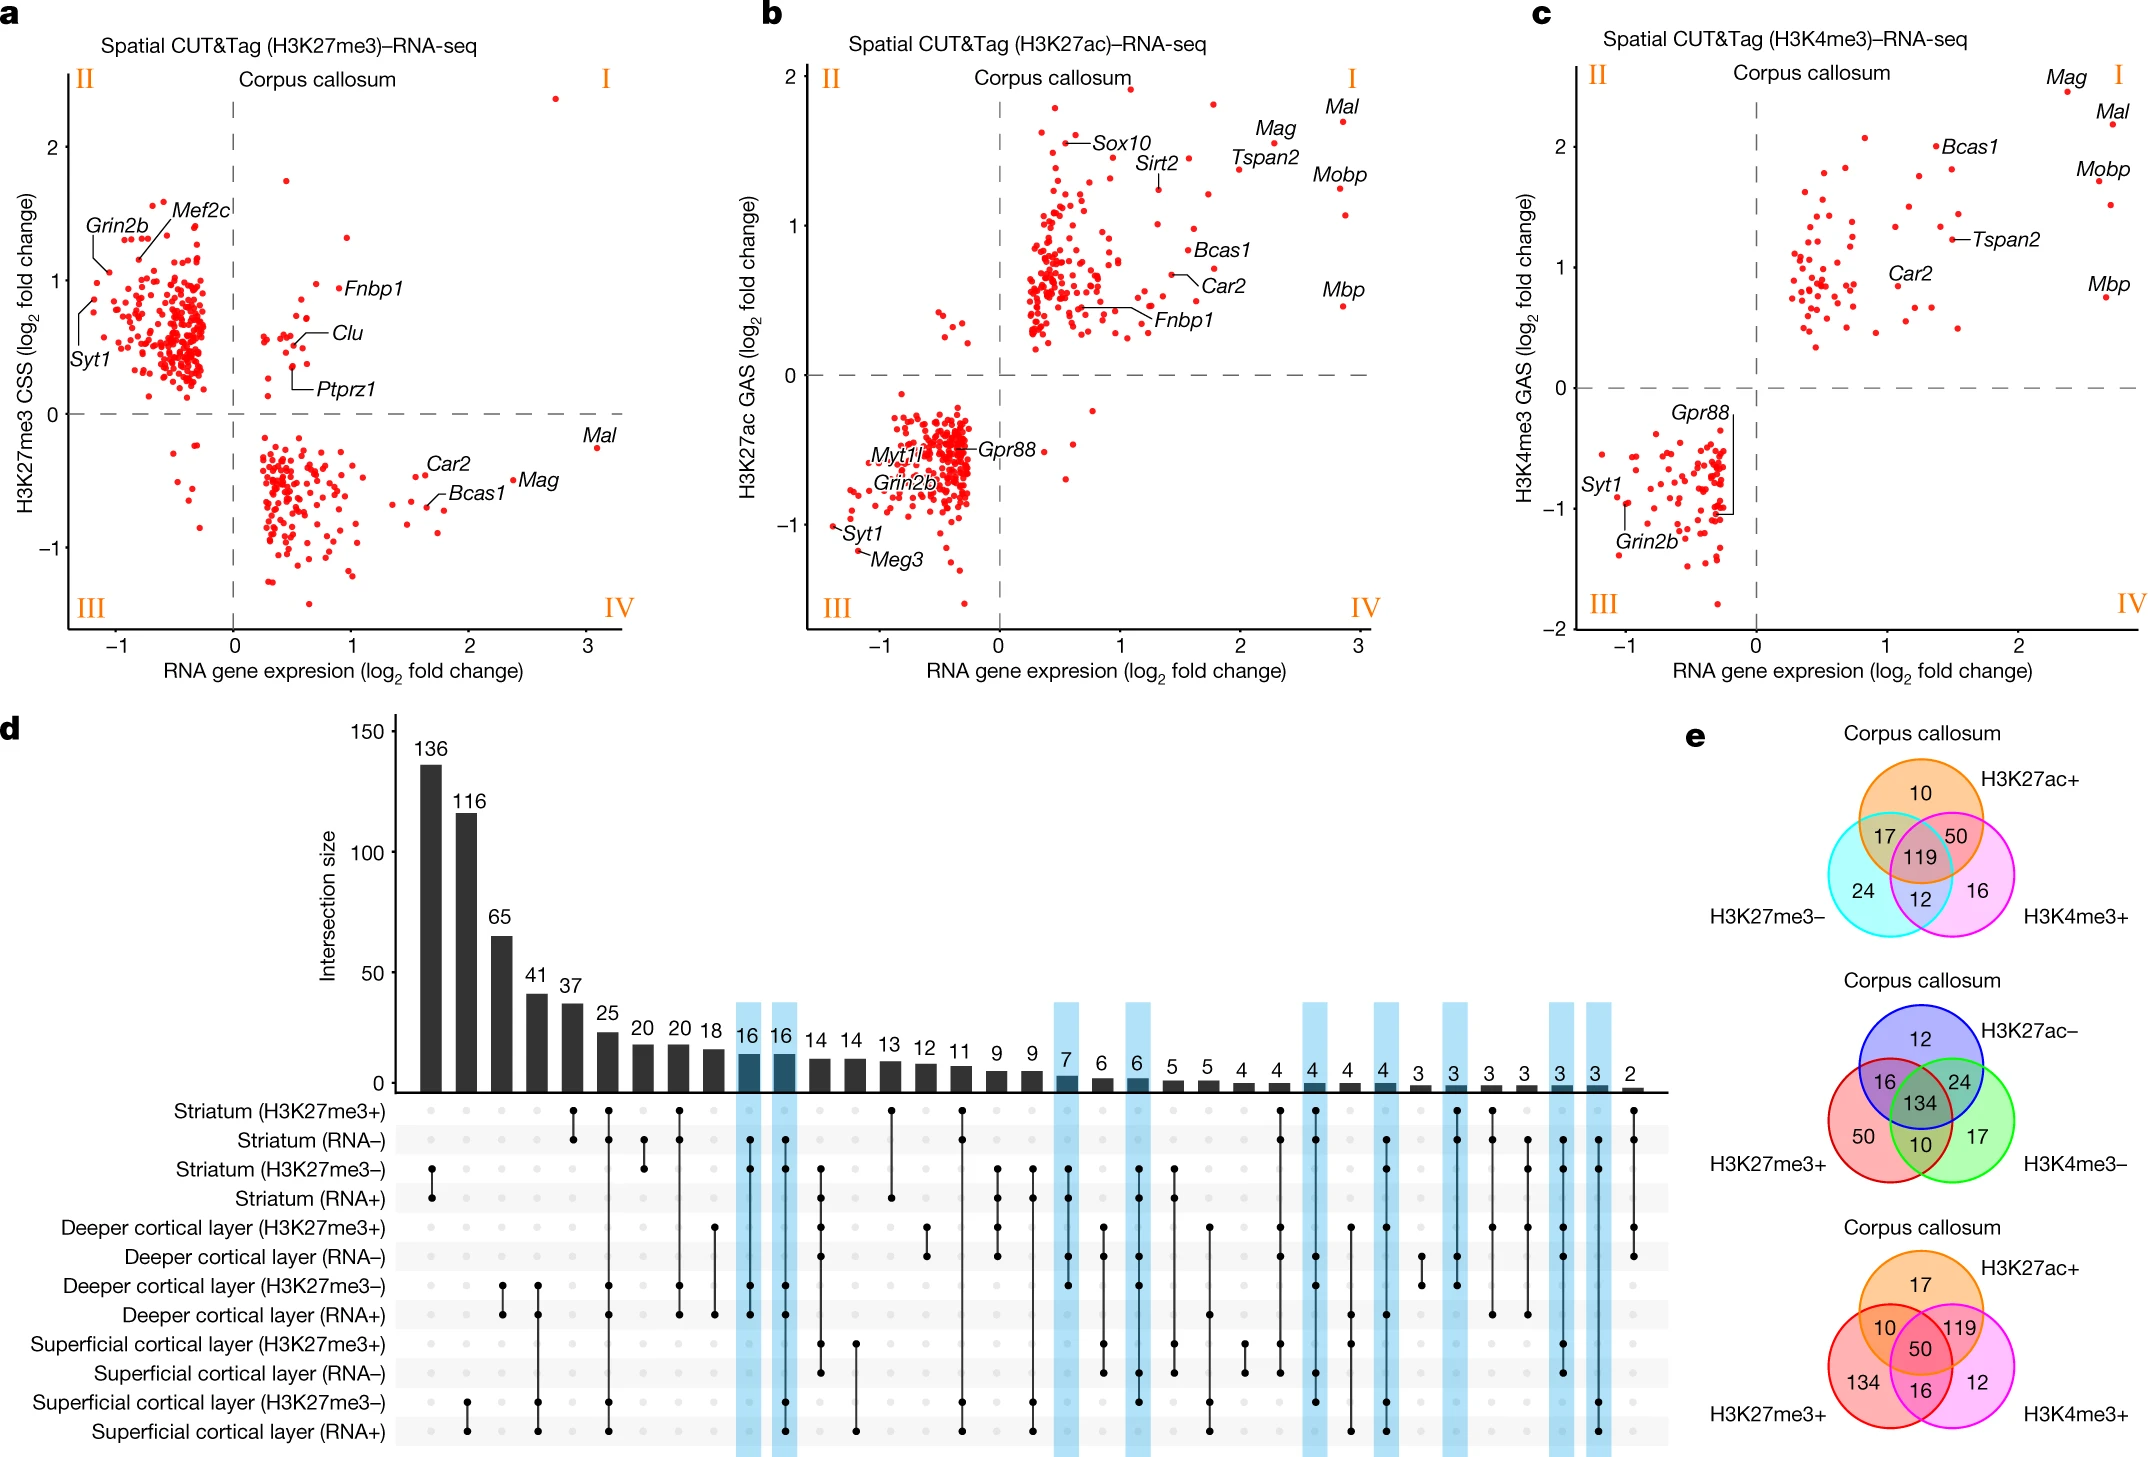
a–c, Correlation of H3K27me3 CSS and RNA gene expression (a), H3K27ac GAS and RNA gene expression (b) and H3K4me3 GAS and RNA gene expression (c) in corpus callosum. d, Upset plot of H3K27me3 CSS and RNA gene expression in striatum and deeper and superficial cortical layers; –, low CSS or gene expression; +, high CSS or gene expression. e, Venn diagrams showing high (+) or low (–) CSS/GAS for different histone modifications in corpus callosum with common RNA marker genes.
