
Fig. 5: Spatial chromatin accessibility and transcriptome co-profiling of human hippocampus.
From: Spatial epigenome–transcriptome co-profiling of mammalian tissues
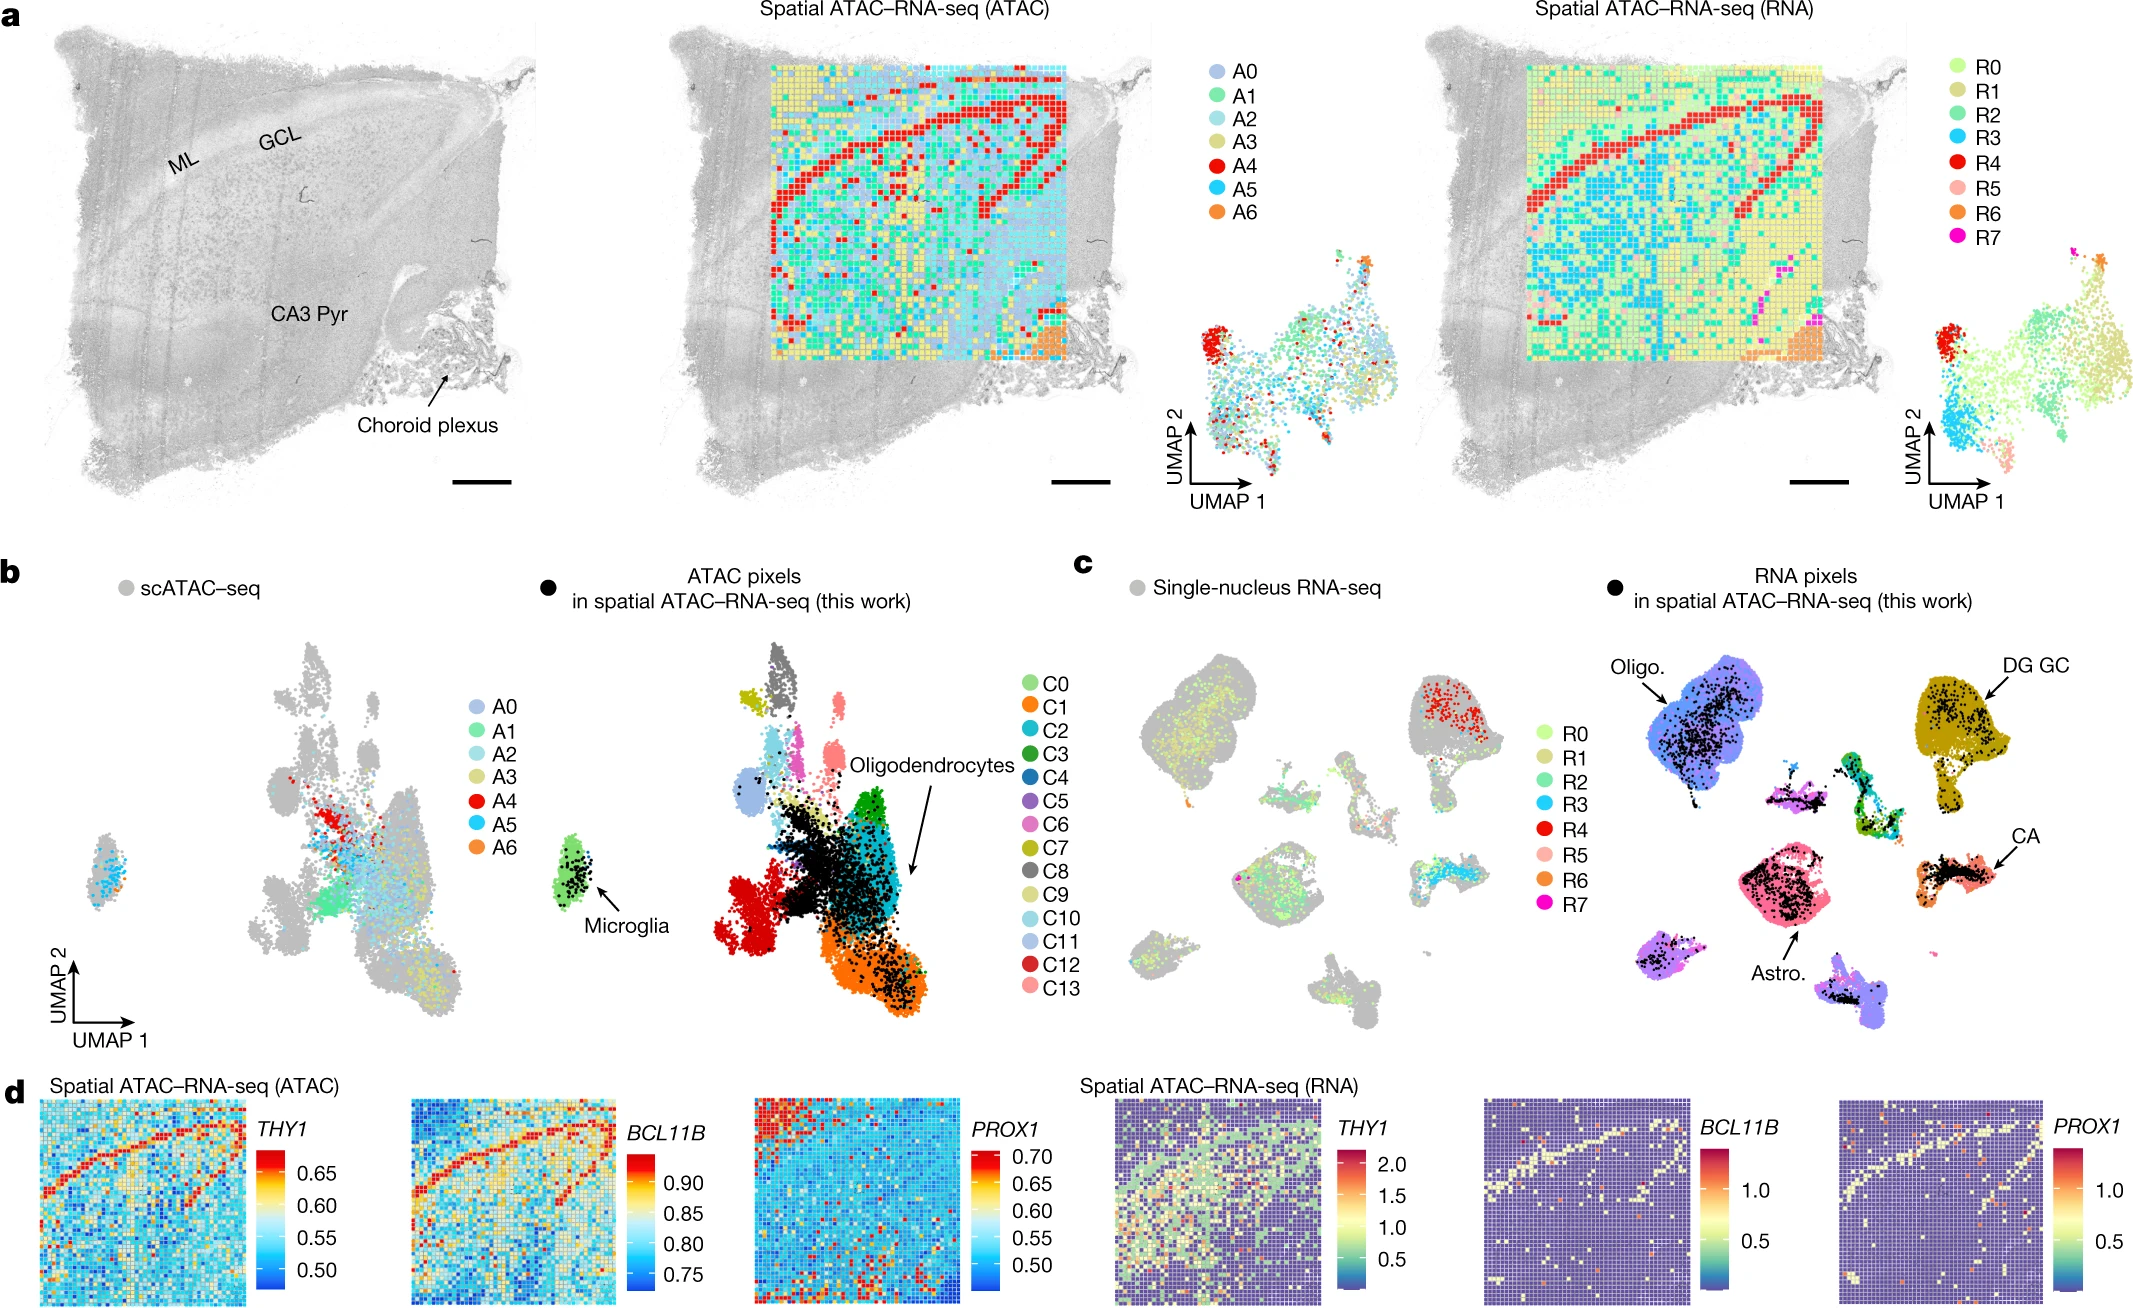
a, Brightfield image, spatial distribution and UMAP of all clusters based on ATAC and RNA in the human hippocampus. ML, molecular layer; Pyr, pyramidal neurons. Pixel size, 50 μm, scale bars, 1 mm. b, Integration of our ATAC data with scATAC-seq data42 from human hippocampus. c, Integration of our RNA data with snRNA-seq data from human brain43. d, Spatial mapping of GAS and gene expression for selected marker genes in different clusters for ATAC and RNA. Oligo, oligodendrocytes; astro, astrocytes; DG, dentate gyrus.
