
Extended Data Fig. 7: F4 statistics for EBA groups to test for excess HG attraction.
From: Early contact between late farming and pastoralist societies in southeastern Europe
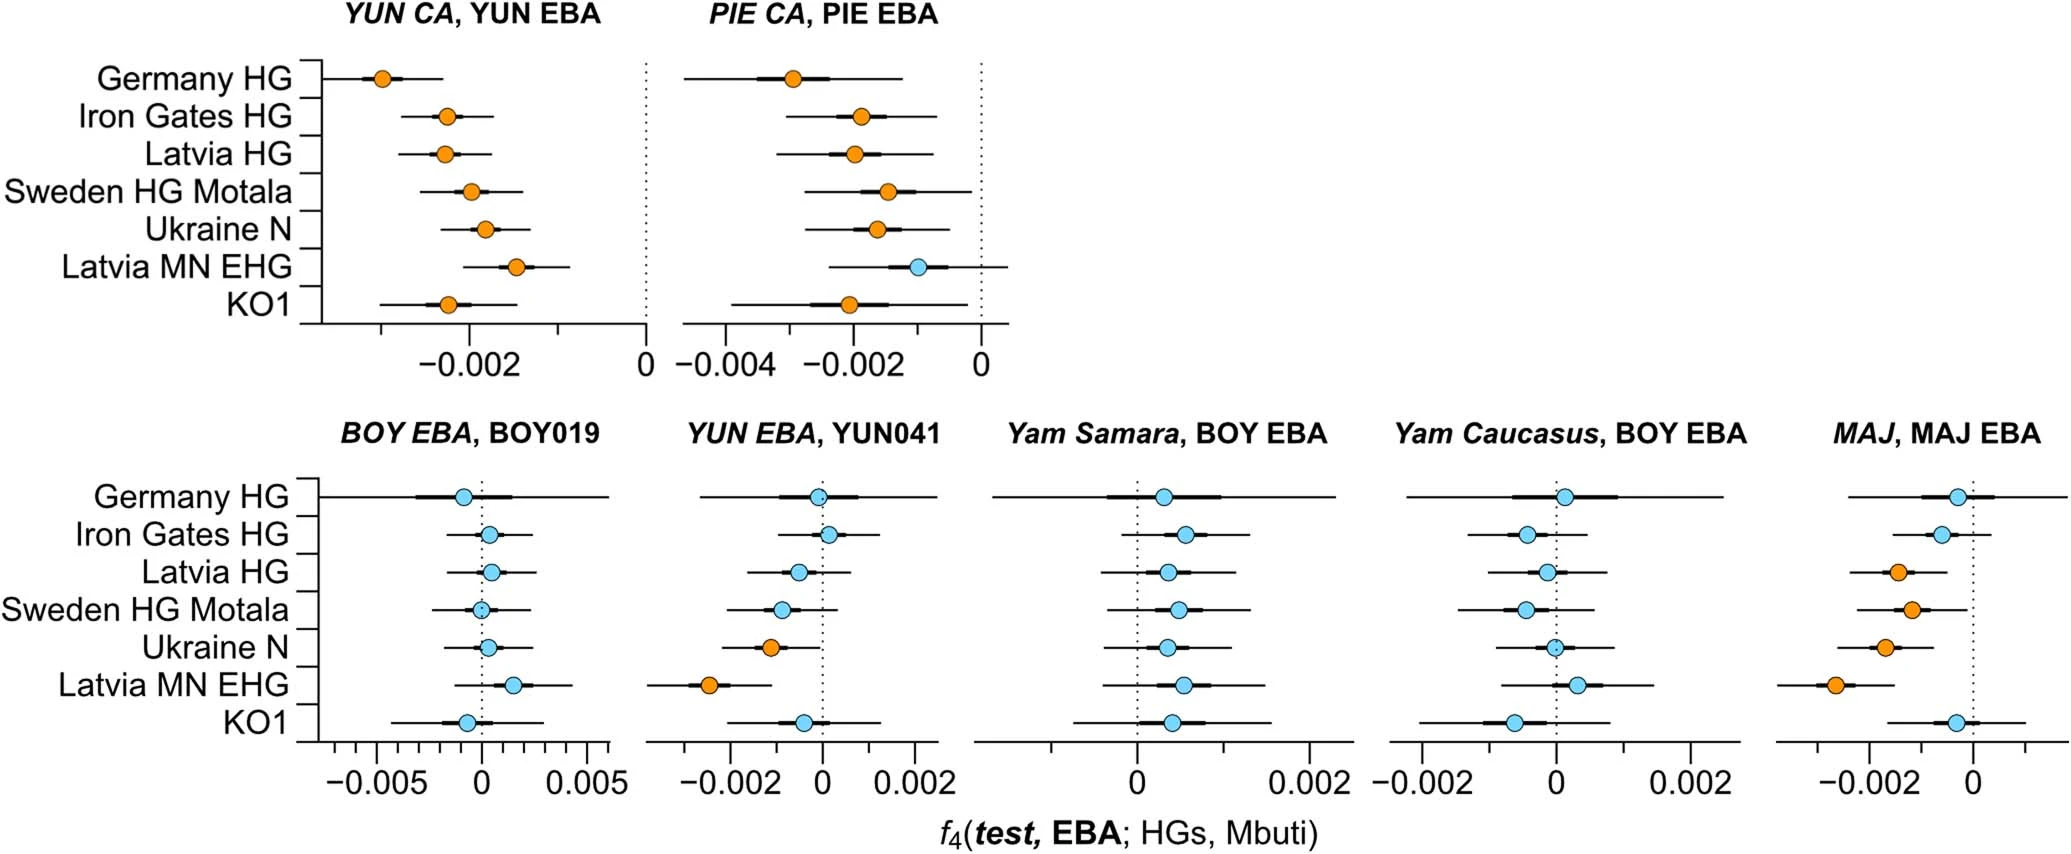
F4 statistics show different attractions of EBA groups to HG groups conditioned on their respective preceding or contemporaneous group. Significant Z-scores (|Z|≥3) are highlighted in orange, f4 values are shown with three standard errors. Test populations are given on the y-axis. Standard errors (SE) were computed with the default block jackknife approach.
