
Fig. 1: Generation of a scRNA-seq dictionary of gene expression signatures in more than 17 immune cell types in response to each of 86 cytokines in vivo.
From: Dictionary of immune responses to cytokines at single-cell resolution
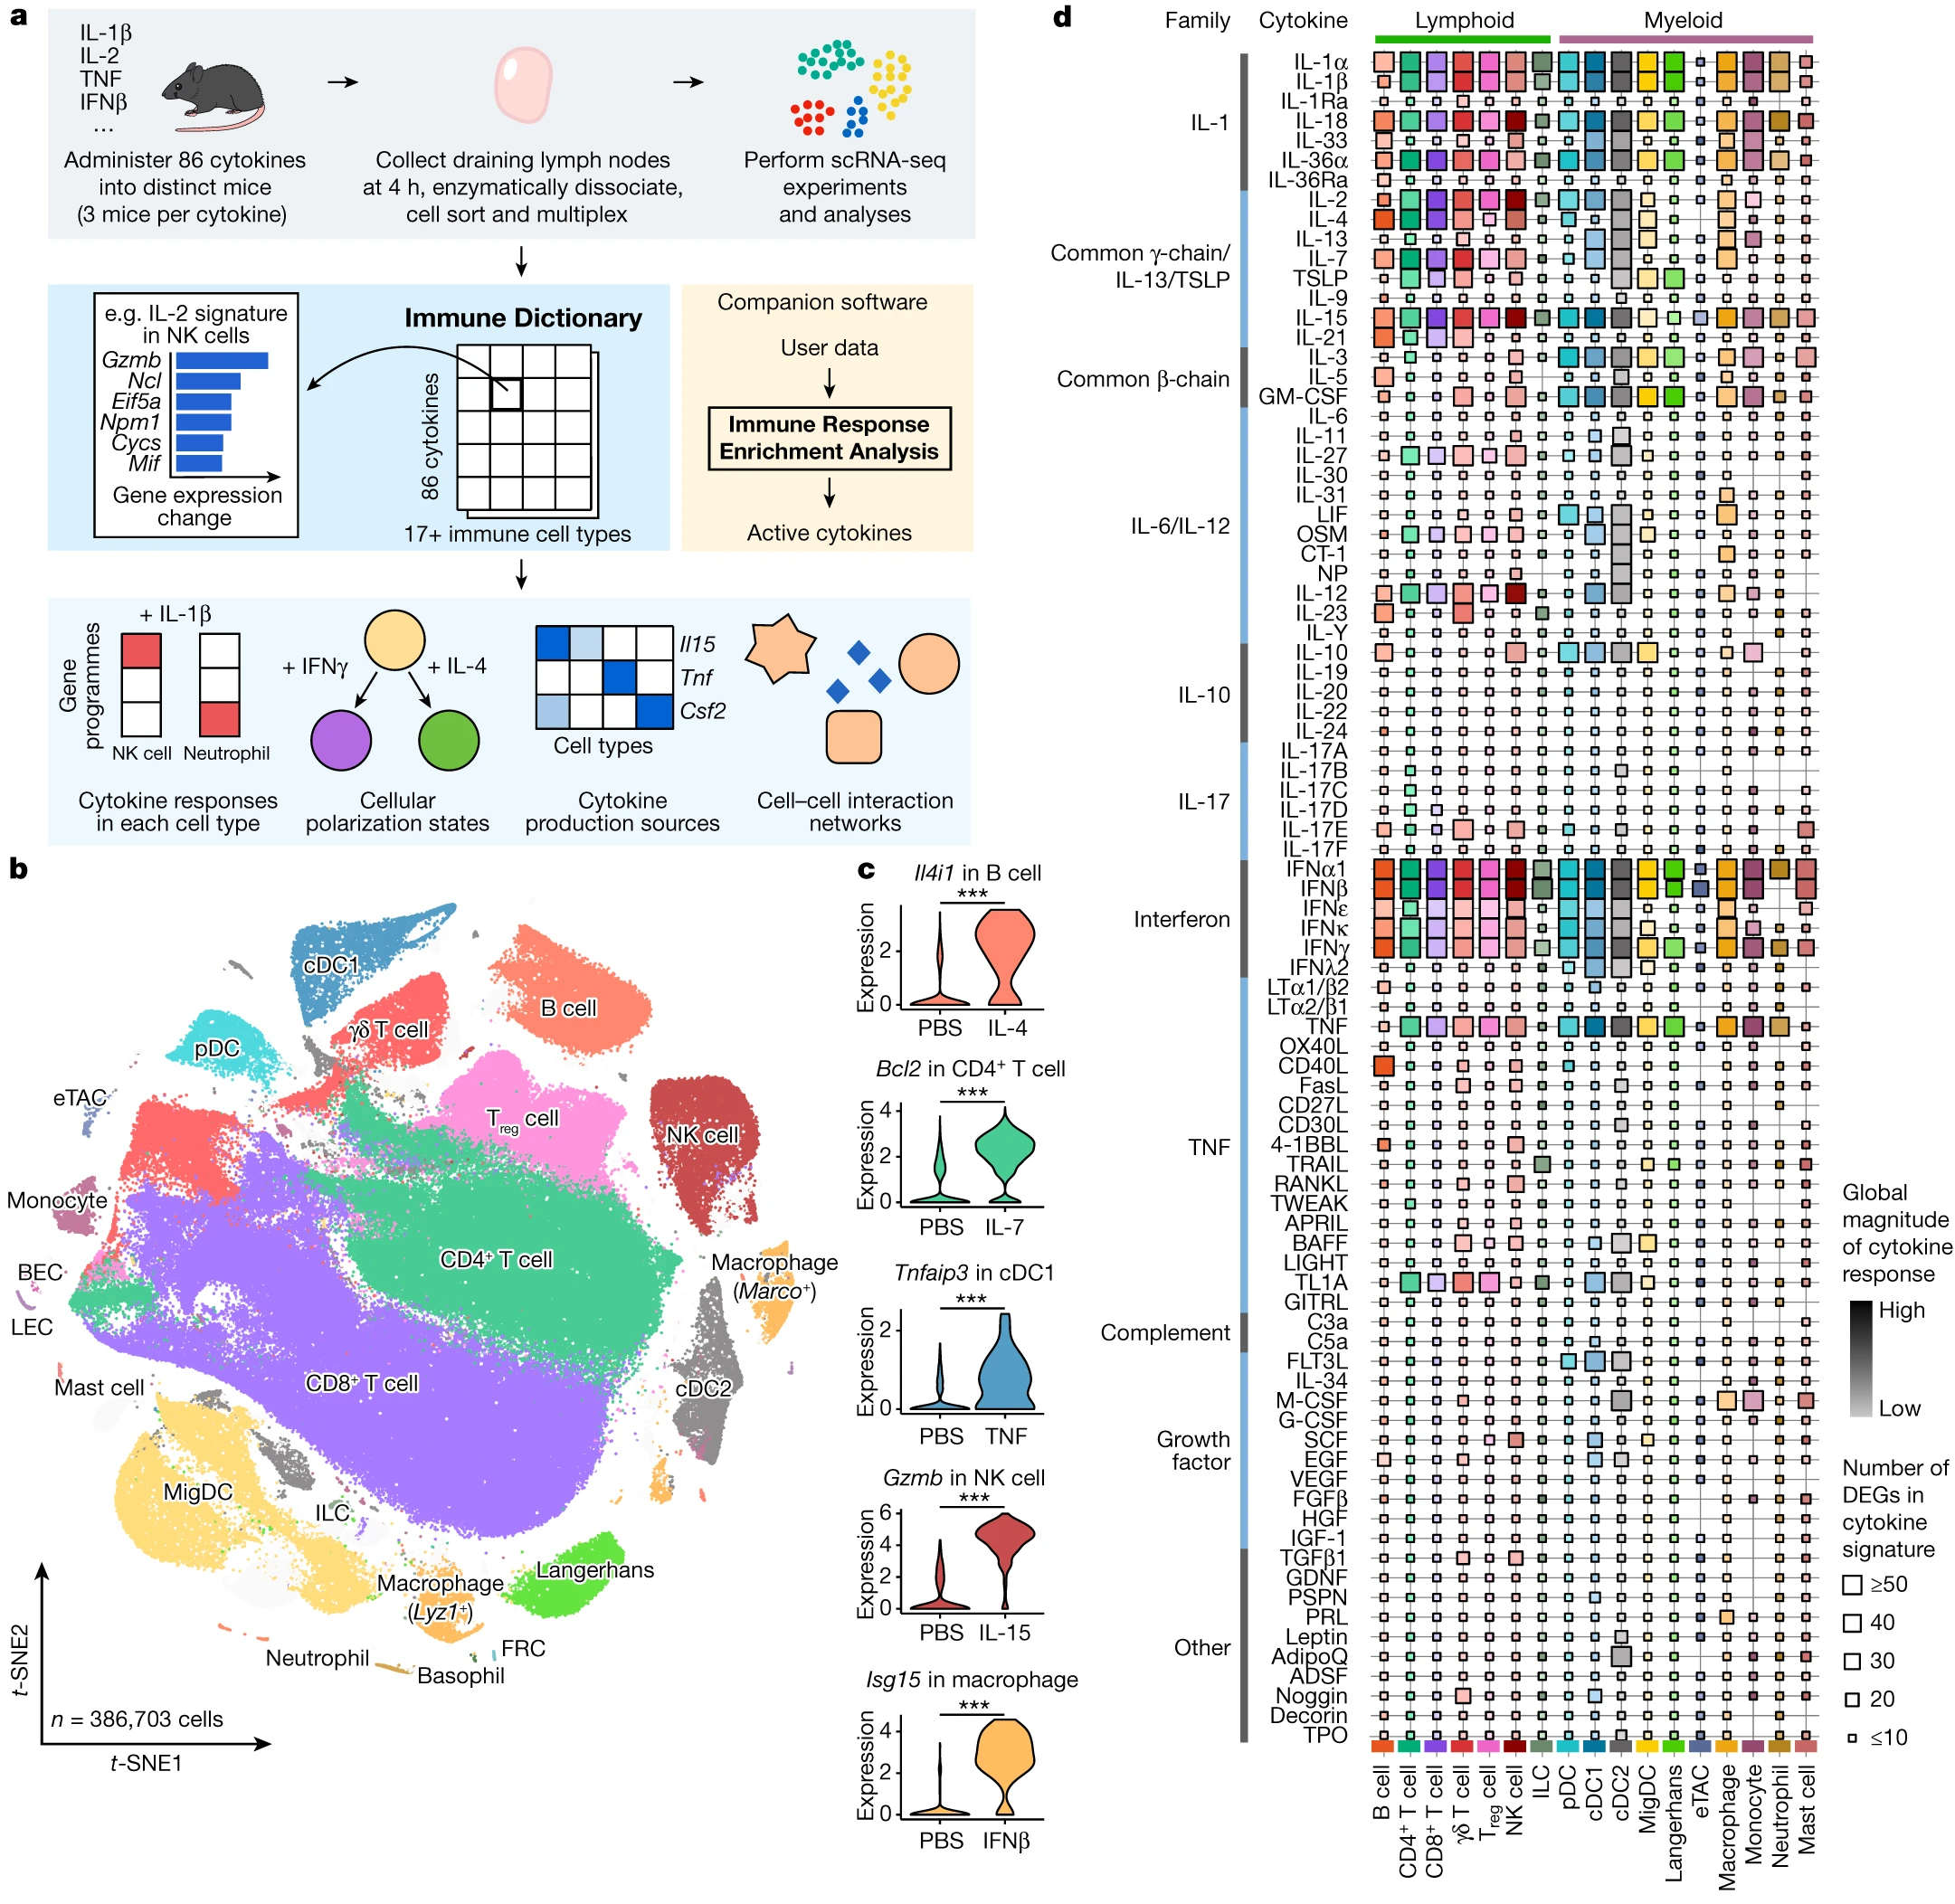
a, Schematic of the experimental and computational workflow. First row, data generation procedures; second row, illustration of the Immune Dictionary and its companion software IREA; third row, analyses of the Immune Dictionary. b, t-distributed stochastic neighbour embedding (t-SNE) map of all cells collected from lymph nodes after cytokine stimulation or without stimulation (PBS controls) coloured by cell-type identity. Cells were sorted to rebalance frequencies of major cell types. c, Violin plots of expression levels of well-established cytokine-responsive genes following PBS or cytokine treatment. ***False discovery rate (FDR)-adjusted P < 0.001, two-sided Wilcoxon rank-sum test. d, Quantitative representation of overall transcriptomic response levels in each cell type 4 h after cytokine stimulation compared with PBS controls. Each cell type is analysed independently and is represented by a distinct colour, following the colour codes in b and c. Colour saturation indicates the magnitude of the response. Size indicates the number of genes with significant differential expression (absolute log2(fold change (FC)) > 0.25 and FDR-adjusted P < 0.05, two-sided Wilcoxon rank-sum test) in each cytokine signature.
