
Fig. 3: Integrative analysis to identify the potential enhancer–gene connections across the whole mouse brain.
From: Single-cell analysis of chromatin accessibility in the adult mouse brain
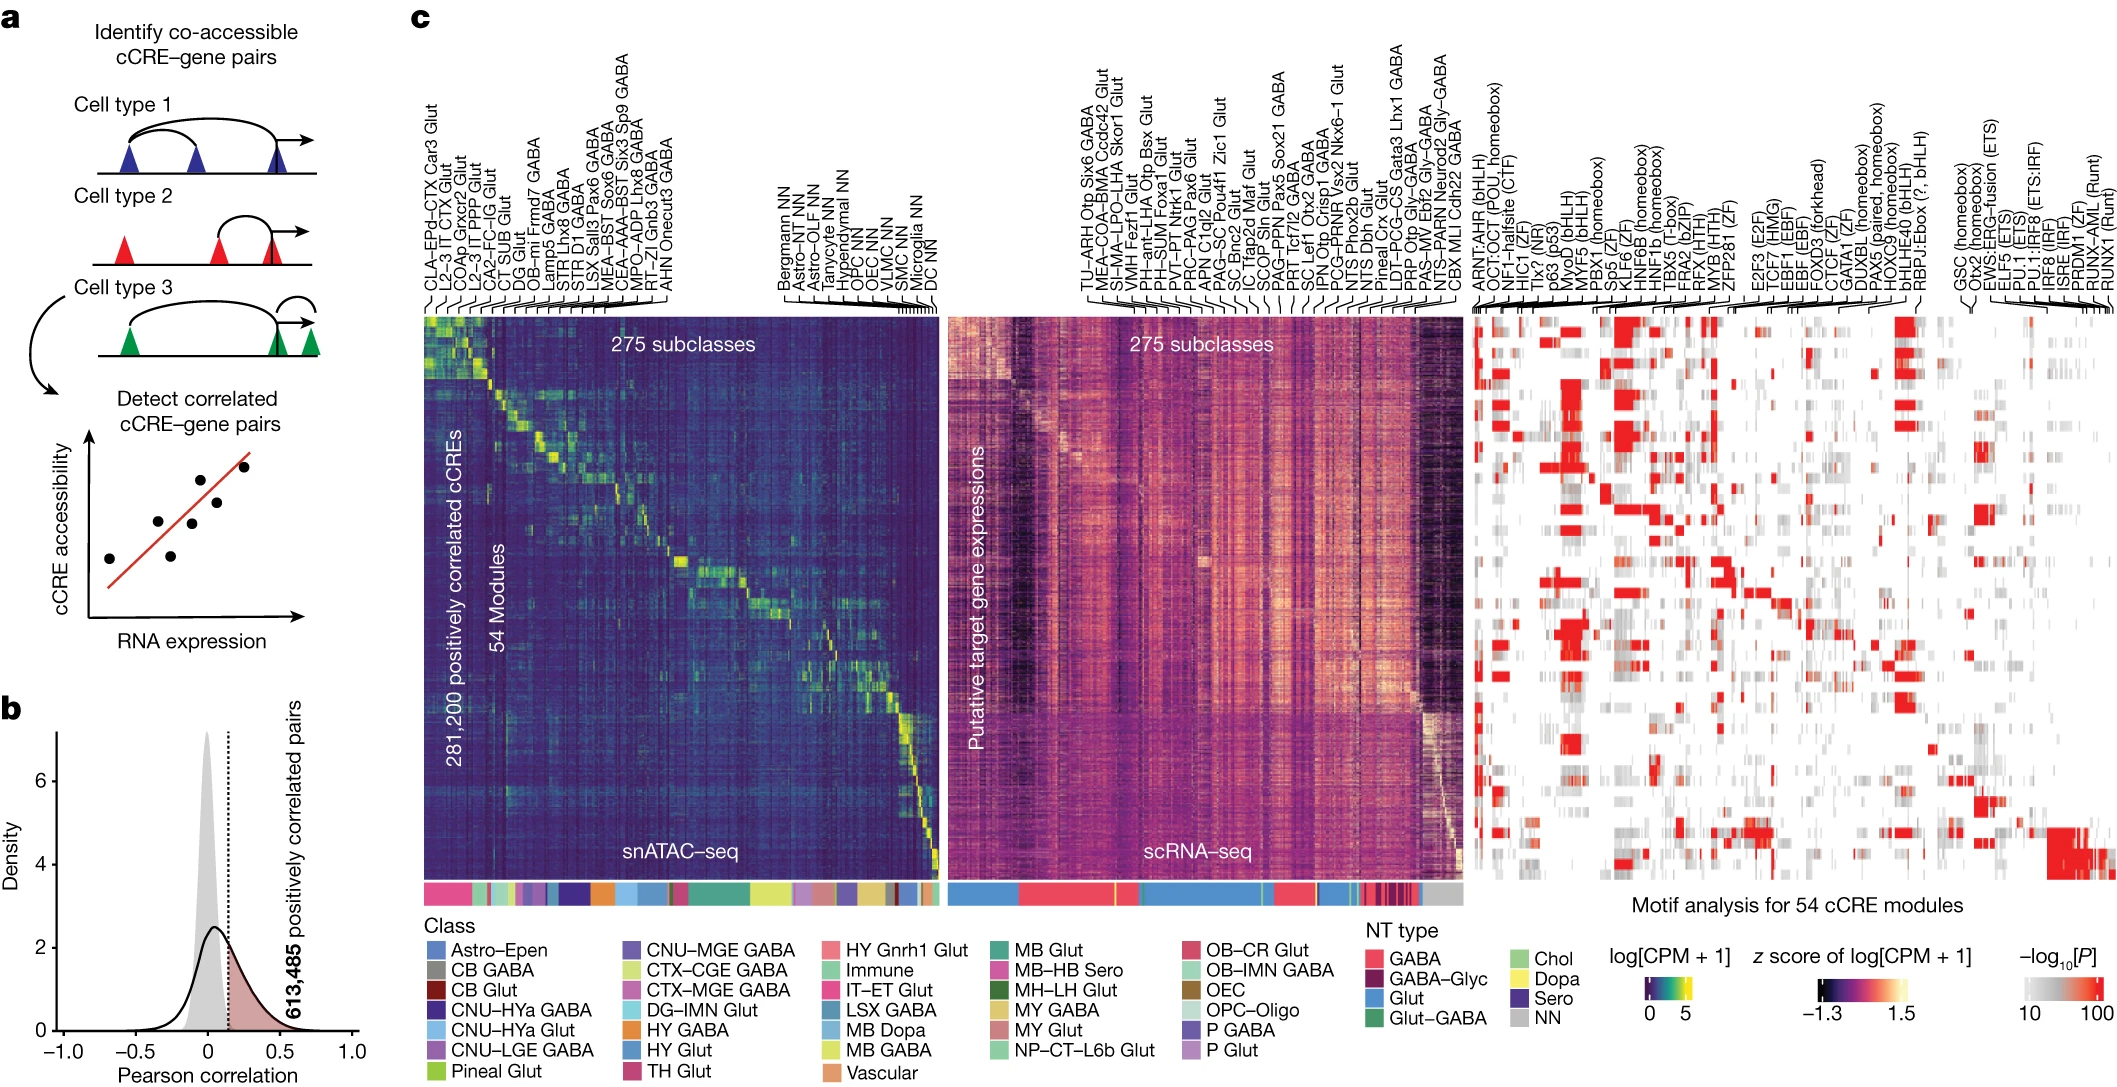
a, Schematic of the computational strategy used to identify cCREs that are positively correlated with the mRNA expression of the target genes; PCCs were calculated across 275 cell subclasses between the snATAC–seq and scRNA-seq data. Co-accessible cis-regulatory DNA interactions were predicted using Cicero44 for each cell subclass. b, In total, 613,485 pairs (red) of positively correlated cCRE–gene pairs were identified (FDR < 0.01). The grey-filled curve shows the distribution of PCCs for randomly shuffled cCRE–gene pairs. c, The chromatin accessibility of putative enhancers (left); mRNA expression of the linked genes in the 275 cell subclasses across the whole mouse brain (middle); and the enrichment of known TF motifs in distinct enhancer gene modules (right). A total of 428 out of 440 known motifs from HOMER45 with enrichment P < 10−10 is shown. The unadjusted P values were calculated using two-sided Fisher’s exact tests.
