
Fig. 6: Deep-learning models predict chromatin accessibility in different brain cell types from the DNA sequence.
From: Single-cell analysis of chromatin accessibility in the adult mouse brain
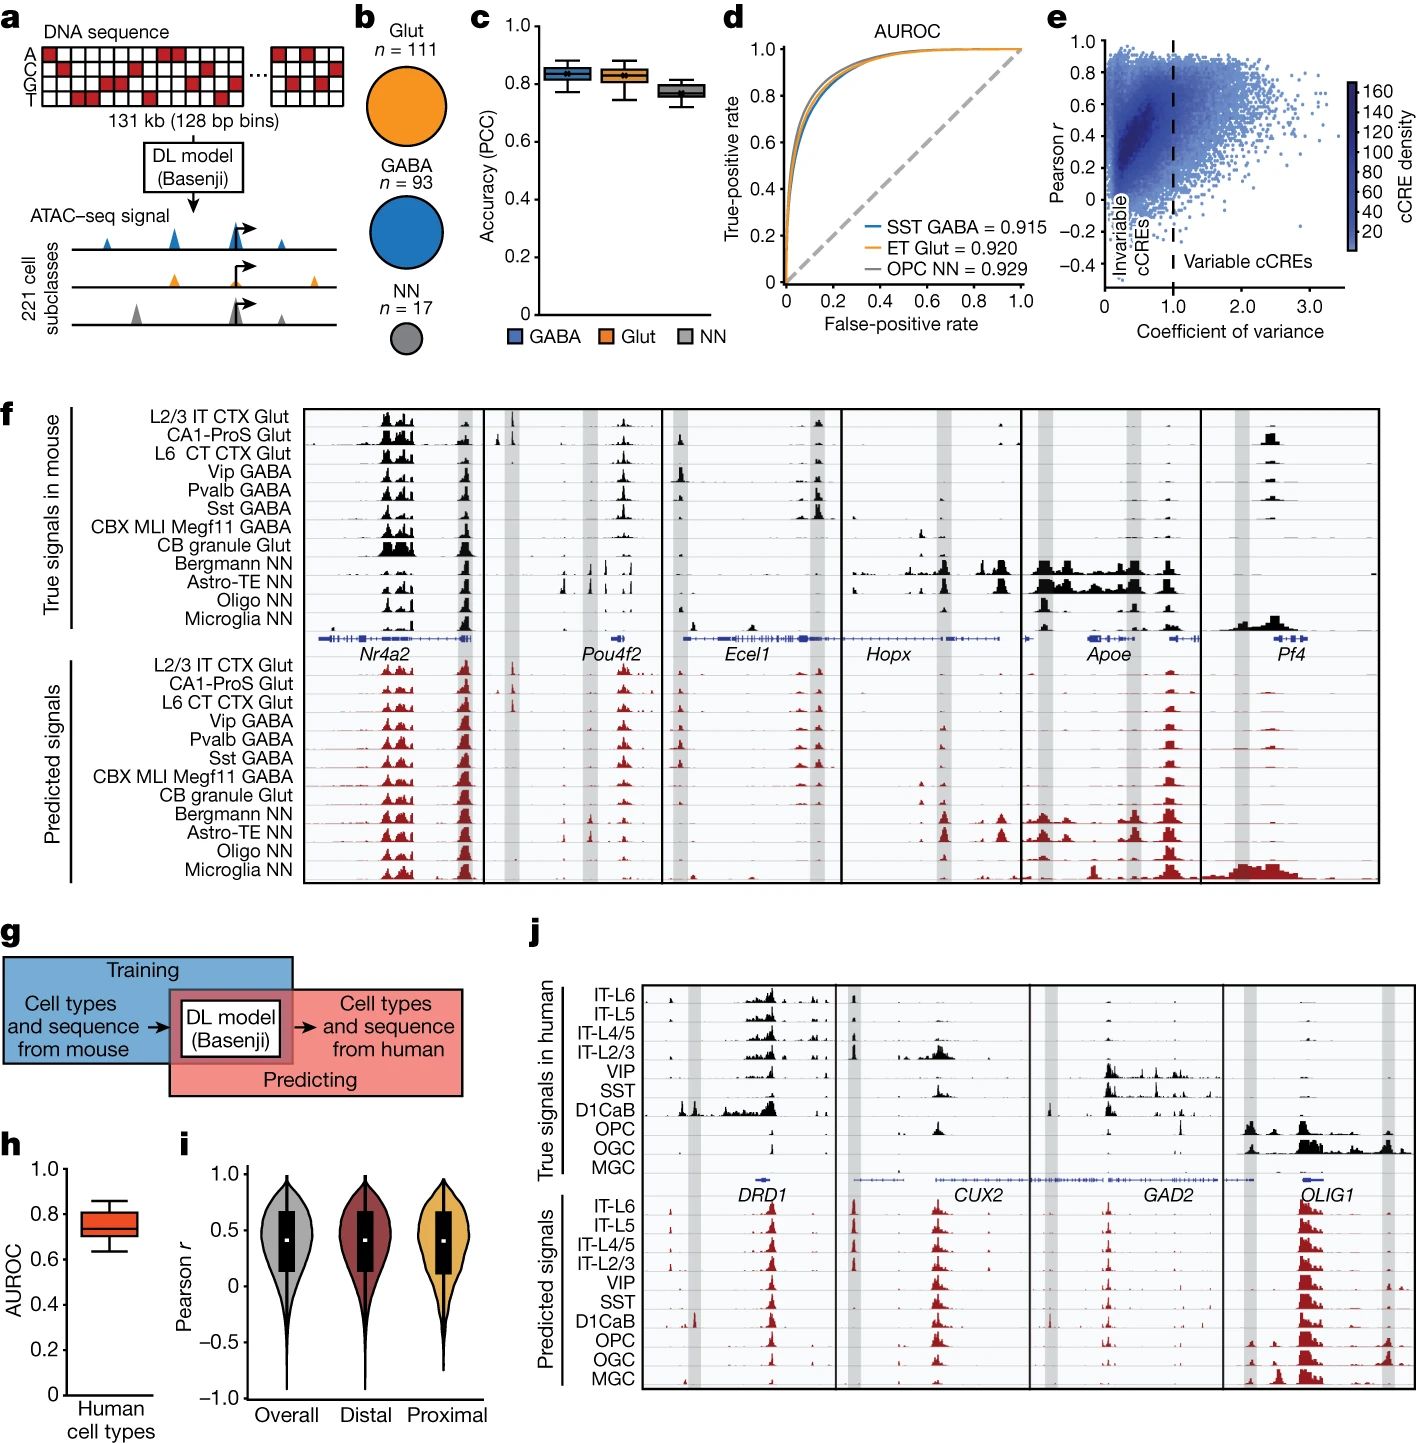
a, Schematic of the deep-learning (DL) model Basenji for predicting chromatin accessibly. b, The number of subclasses of each cell class in the training dataset. c, The accuracy (Pearson correlation) of each class. n = 93 (GABA), n = 111 (Glut) and n = 17 (NN) subclasses. d, The AUROC was calculated for representative subclasses by comparing the peaks called from predicted genomic signals with the peaks called from real experimental signals. e, The model’s ability to predict cell-type-specific patterns of open chromatin. The coefficient of variance (variance/mean) across cell types was compared with the Pearson r calculated between true signals and the predicted signals across cell subclasses. Each dot represents one cCRE in the testing set. f, True signals from ATAC–seq data in mouse cell subclasses were compared with the predicted chromatin accessibility in the test set. Representative loci near Nr4a2, Pou4f2, Ecel1, Hopx, Apoe and Pf4 are shown. g, Schematic of predicting potential chromatin accessibility signals using human DNA sequence as inputs. h, The AUROC was calculated for matched human cell types. n = 26 cell types for the human brain dataset. i, The Pearson r of true signals and the predicted signals across cell types for all tested cCREs, tested distal cCREs and tested proximal cCREs. The numbers of overall, distal and proximal cCREs are 452,531, 437,207 and 15,324, respectively. j, True signals captured from ATAC–seq analysis in human cell types and predicted chromatin accessibilities are shown at representative genomic loci near the genes CUX2, GAD2, DRD1 and OLIG1. Cell-type-specific cCREs are highlighted in grey. For the box plots, the box limits span the first to third quartiles, the centre line denotes the median and the whiskers show 1.5× the interquartile range.
