
Fig. 1: About 75% of global industrial fishing and 25% of other vessel activity is not publicly tracked.
From: Satellite mapping reveals extensive industrial activity at sea
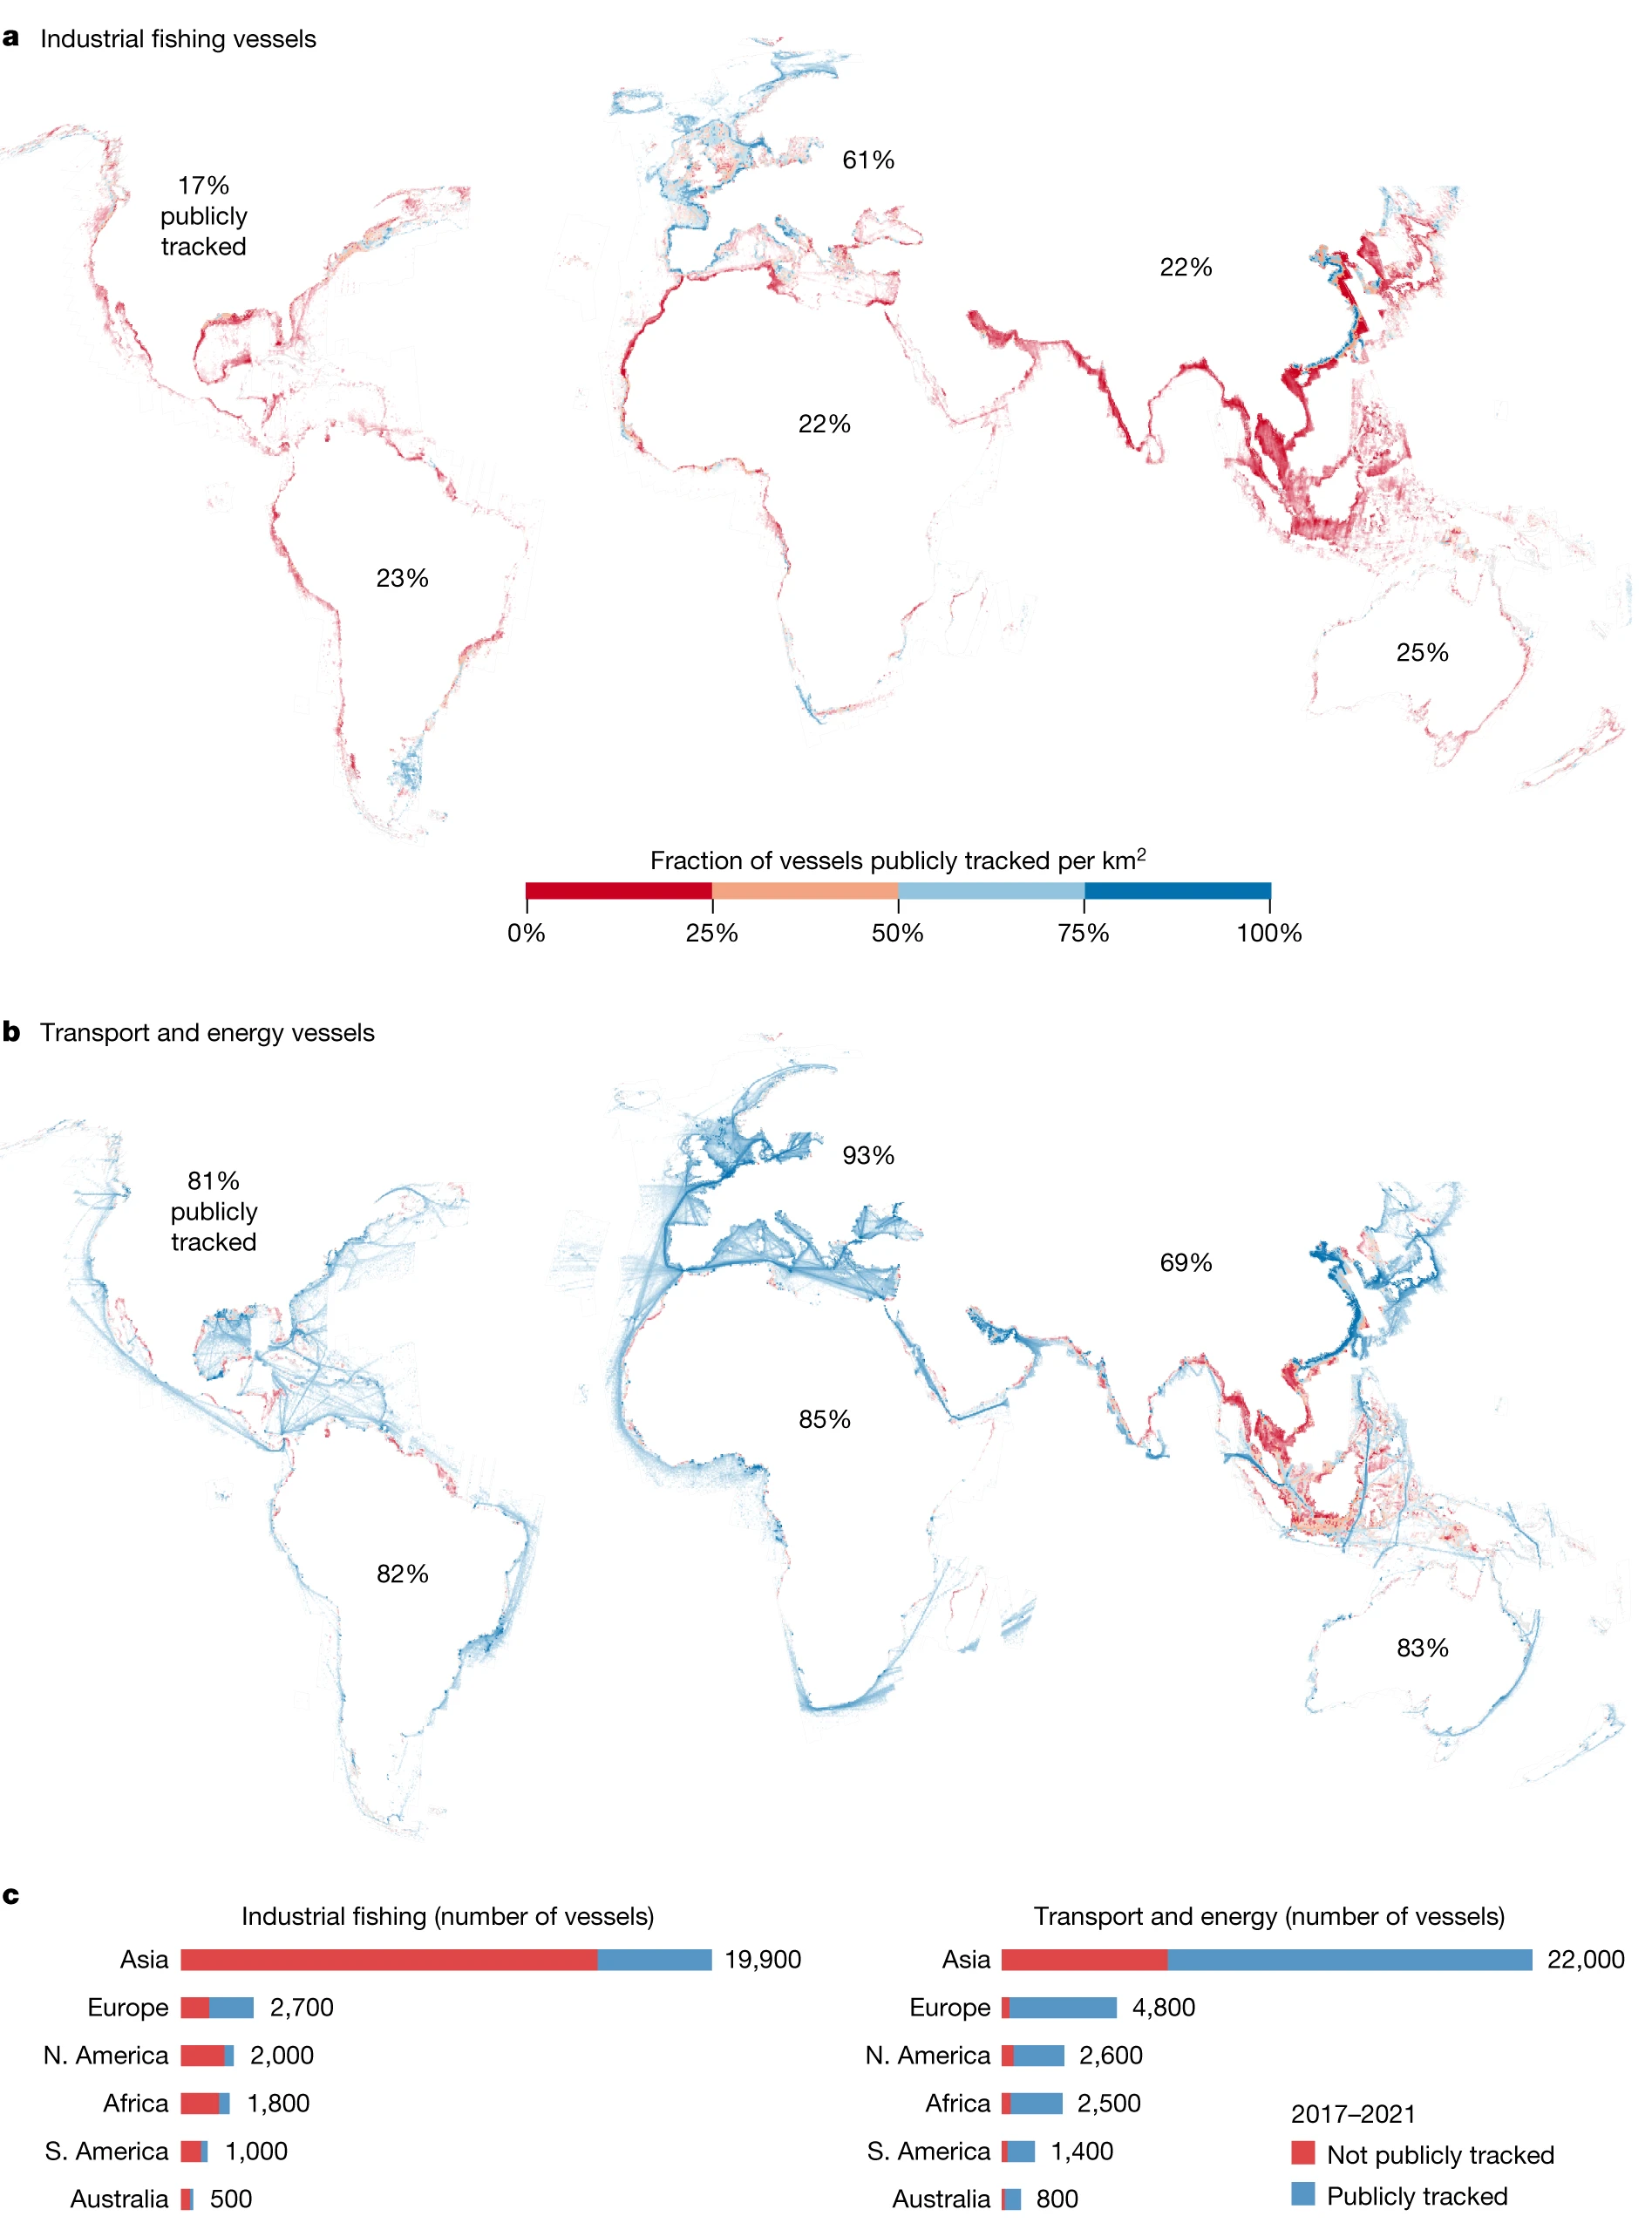
a,b, Per square kilometre, the average number of industrial fishing vessels (a) and shipping, tanker, passenger and support vessels (b), from 5 years of satellite SAR imagery. The colour represents the percentage of detected vessels that were matched (blue, publicly tracked) and unmatched (red, not publicly tracked) to known vessel positions from AIS broadcast. c, For each continent, the total number of detected vessels and the respective fraction of publicly and not publicly tracked. The outline around the continents (light grey) shows the area of the ocean with available SAR imagery (see Extended Data Fig. 1 for the spatial distribution of images). ‘N. America’ includes Central American countries. Classification of detected objects was performed with deep learning.
