
Fig. 2: Genetic ancestry transects of western Eurasia.
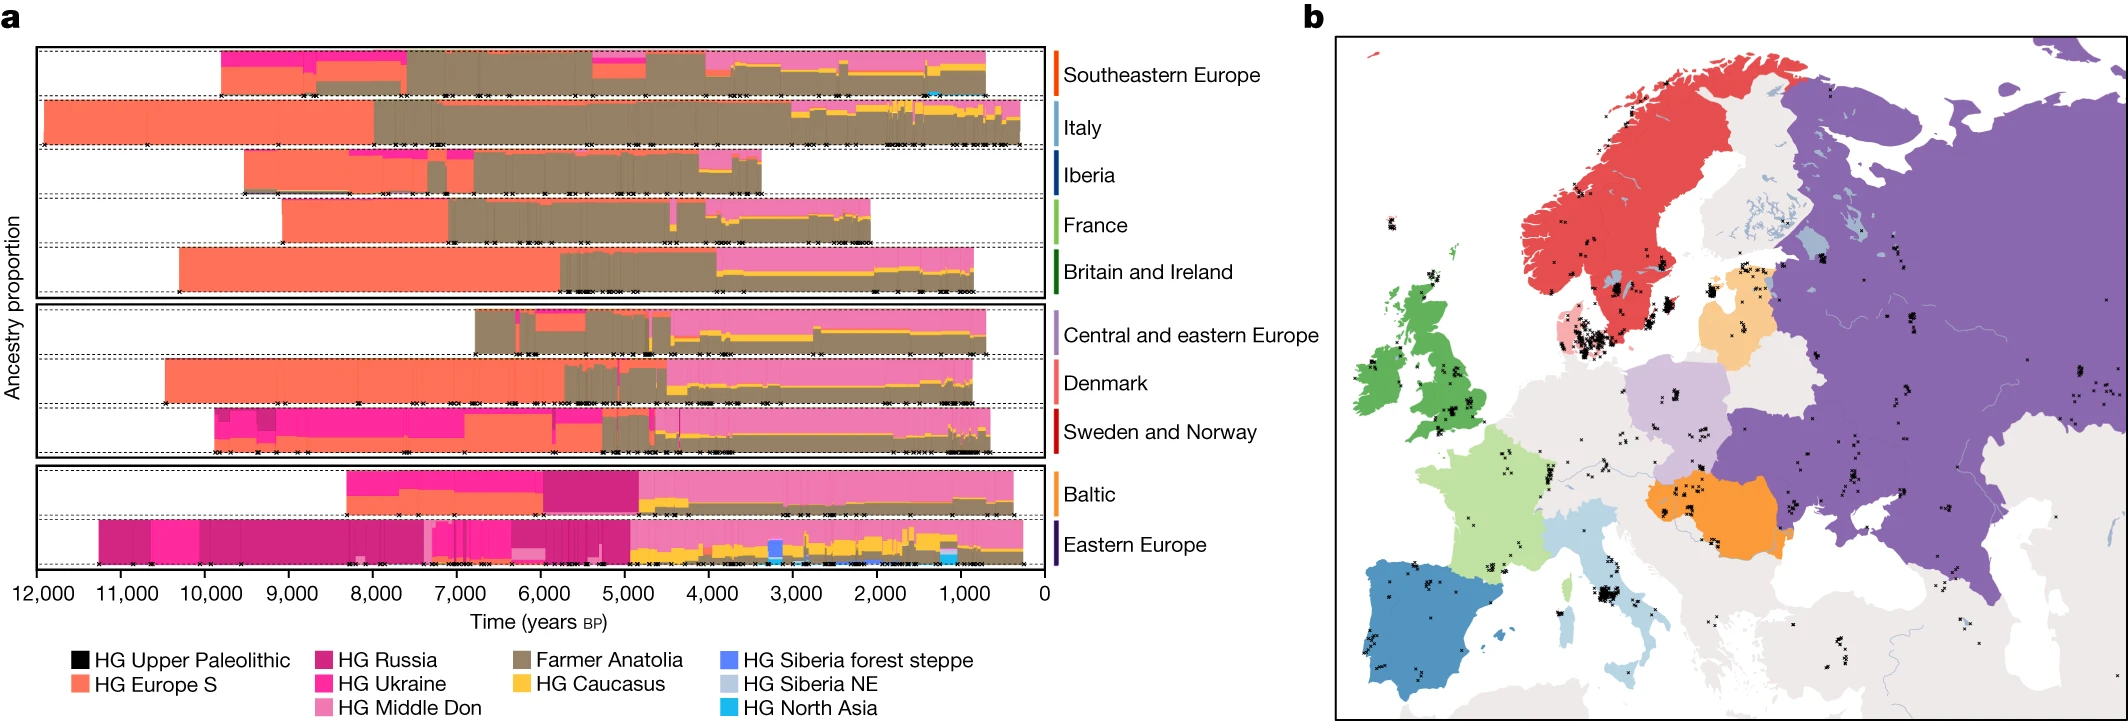
a, Regional timelines of genetic ancestry compositions within the past 12,000 years in western Eurasia. Ancestry proportions in 1,012 imputed ancient genomes (representing populations west of the Urals) inferred using supervised ancestry modelling with the ‘deep’ HG ancestry source groups. Coloured bars within the timelines represent ancestry proportions for temporally consecutive individuals, with the width corresponding to their age difference. Individuals with identical age were offset along the time axis by adding random jitter. b, Map highlighting geographical areas (coloured areas) for samples included in the individual regional timelines, and excavation locations (black crosses). Only shotgun-sequenced genomes were used in our study, so the exact timing of ancestry shifts might differ slightly from previous studies if they are based on different types of data from different individuals.
