
Fig. 4: Comparison of inter-frame detection performance for our method and state-of-the-art methods.
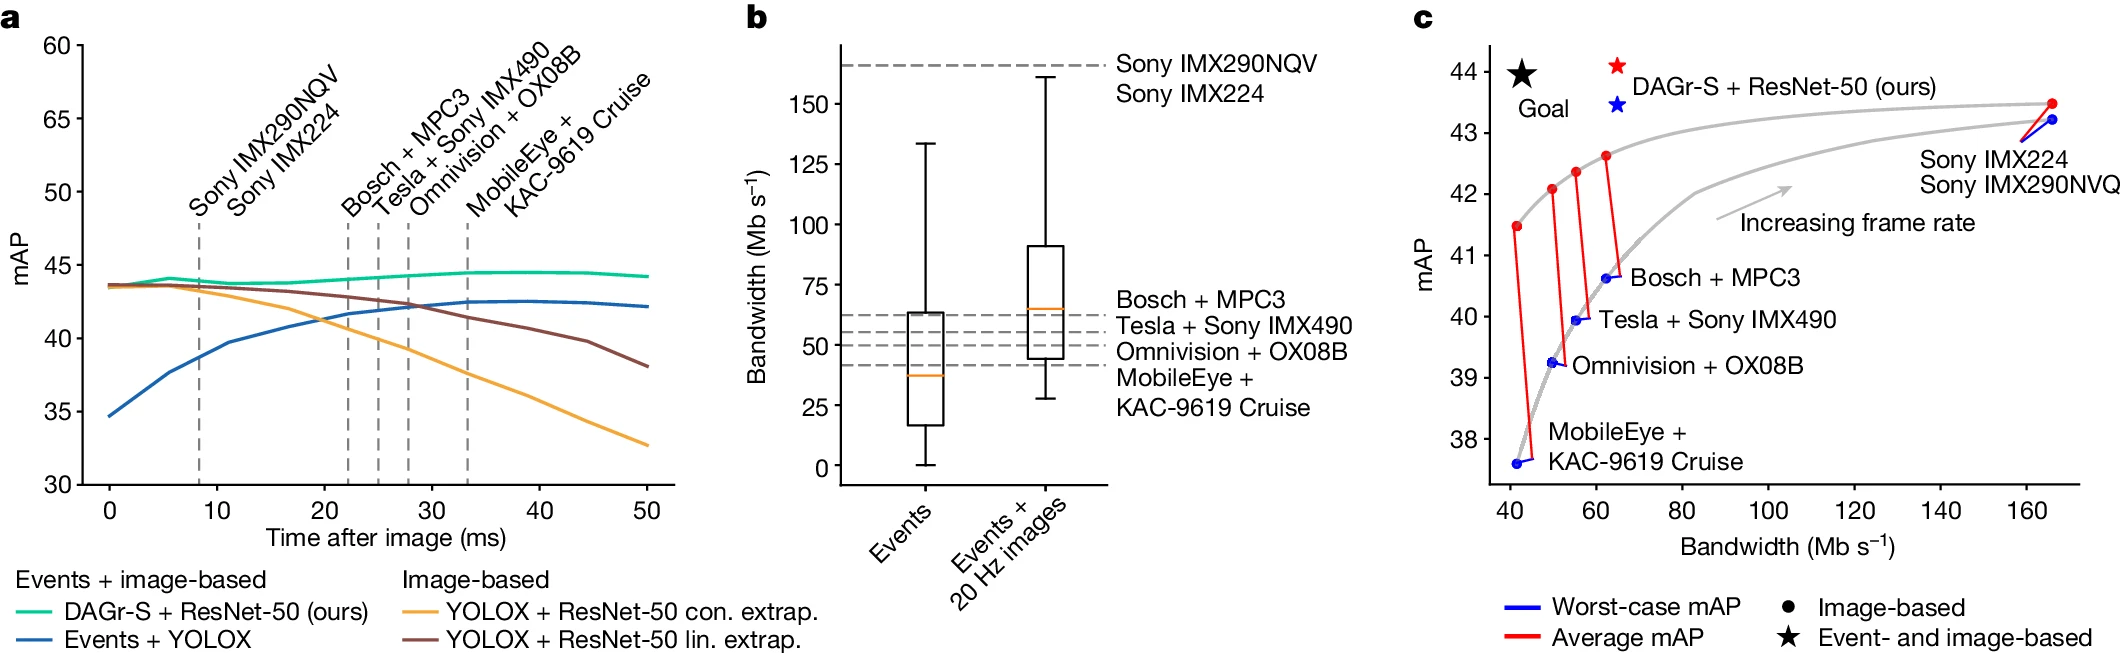
a, Detection performance in terms of mAP for our method (cyan), baseline method Events + YOLOX (ref. 34) (blue) and image-based method YOLOX (ref. 34) with constant and linear extrapolation (yellow and brown). Grey lines correspond to inter-frame intervals of automotive cameras. b, Bandwidth requirements of these cameras, and our hybrid event + image camera setup. The red lines correspond to the median, and the box contains data between the first and third quartiles. The distance from the box edges to the whiskers measures 1.5 times the interquartile range. c, Bandwidth and performance comparison. For each frame rate (and resulting bandwidth), the worst-case (blue) and average (red) mAP is plotted. For frame-based methods, these lie on the grey line. The performance using the hybrid event + image camera setup is plotted as a red star (mean) and blue star (worst case). The black star points in the direction of the ideal performance–bandwidth trade-off.
