
Fig. 1: Overview of the approach to generate and integrate genomic data on the 4D nucleome.
From: An integrated view of the structure and function of the human 4D nucleome
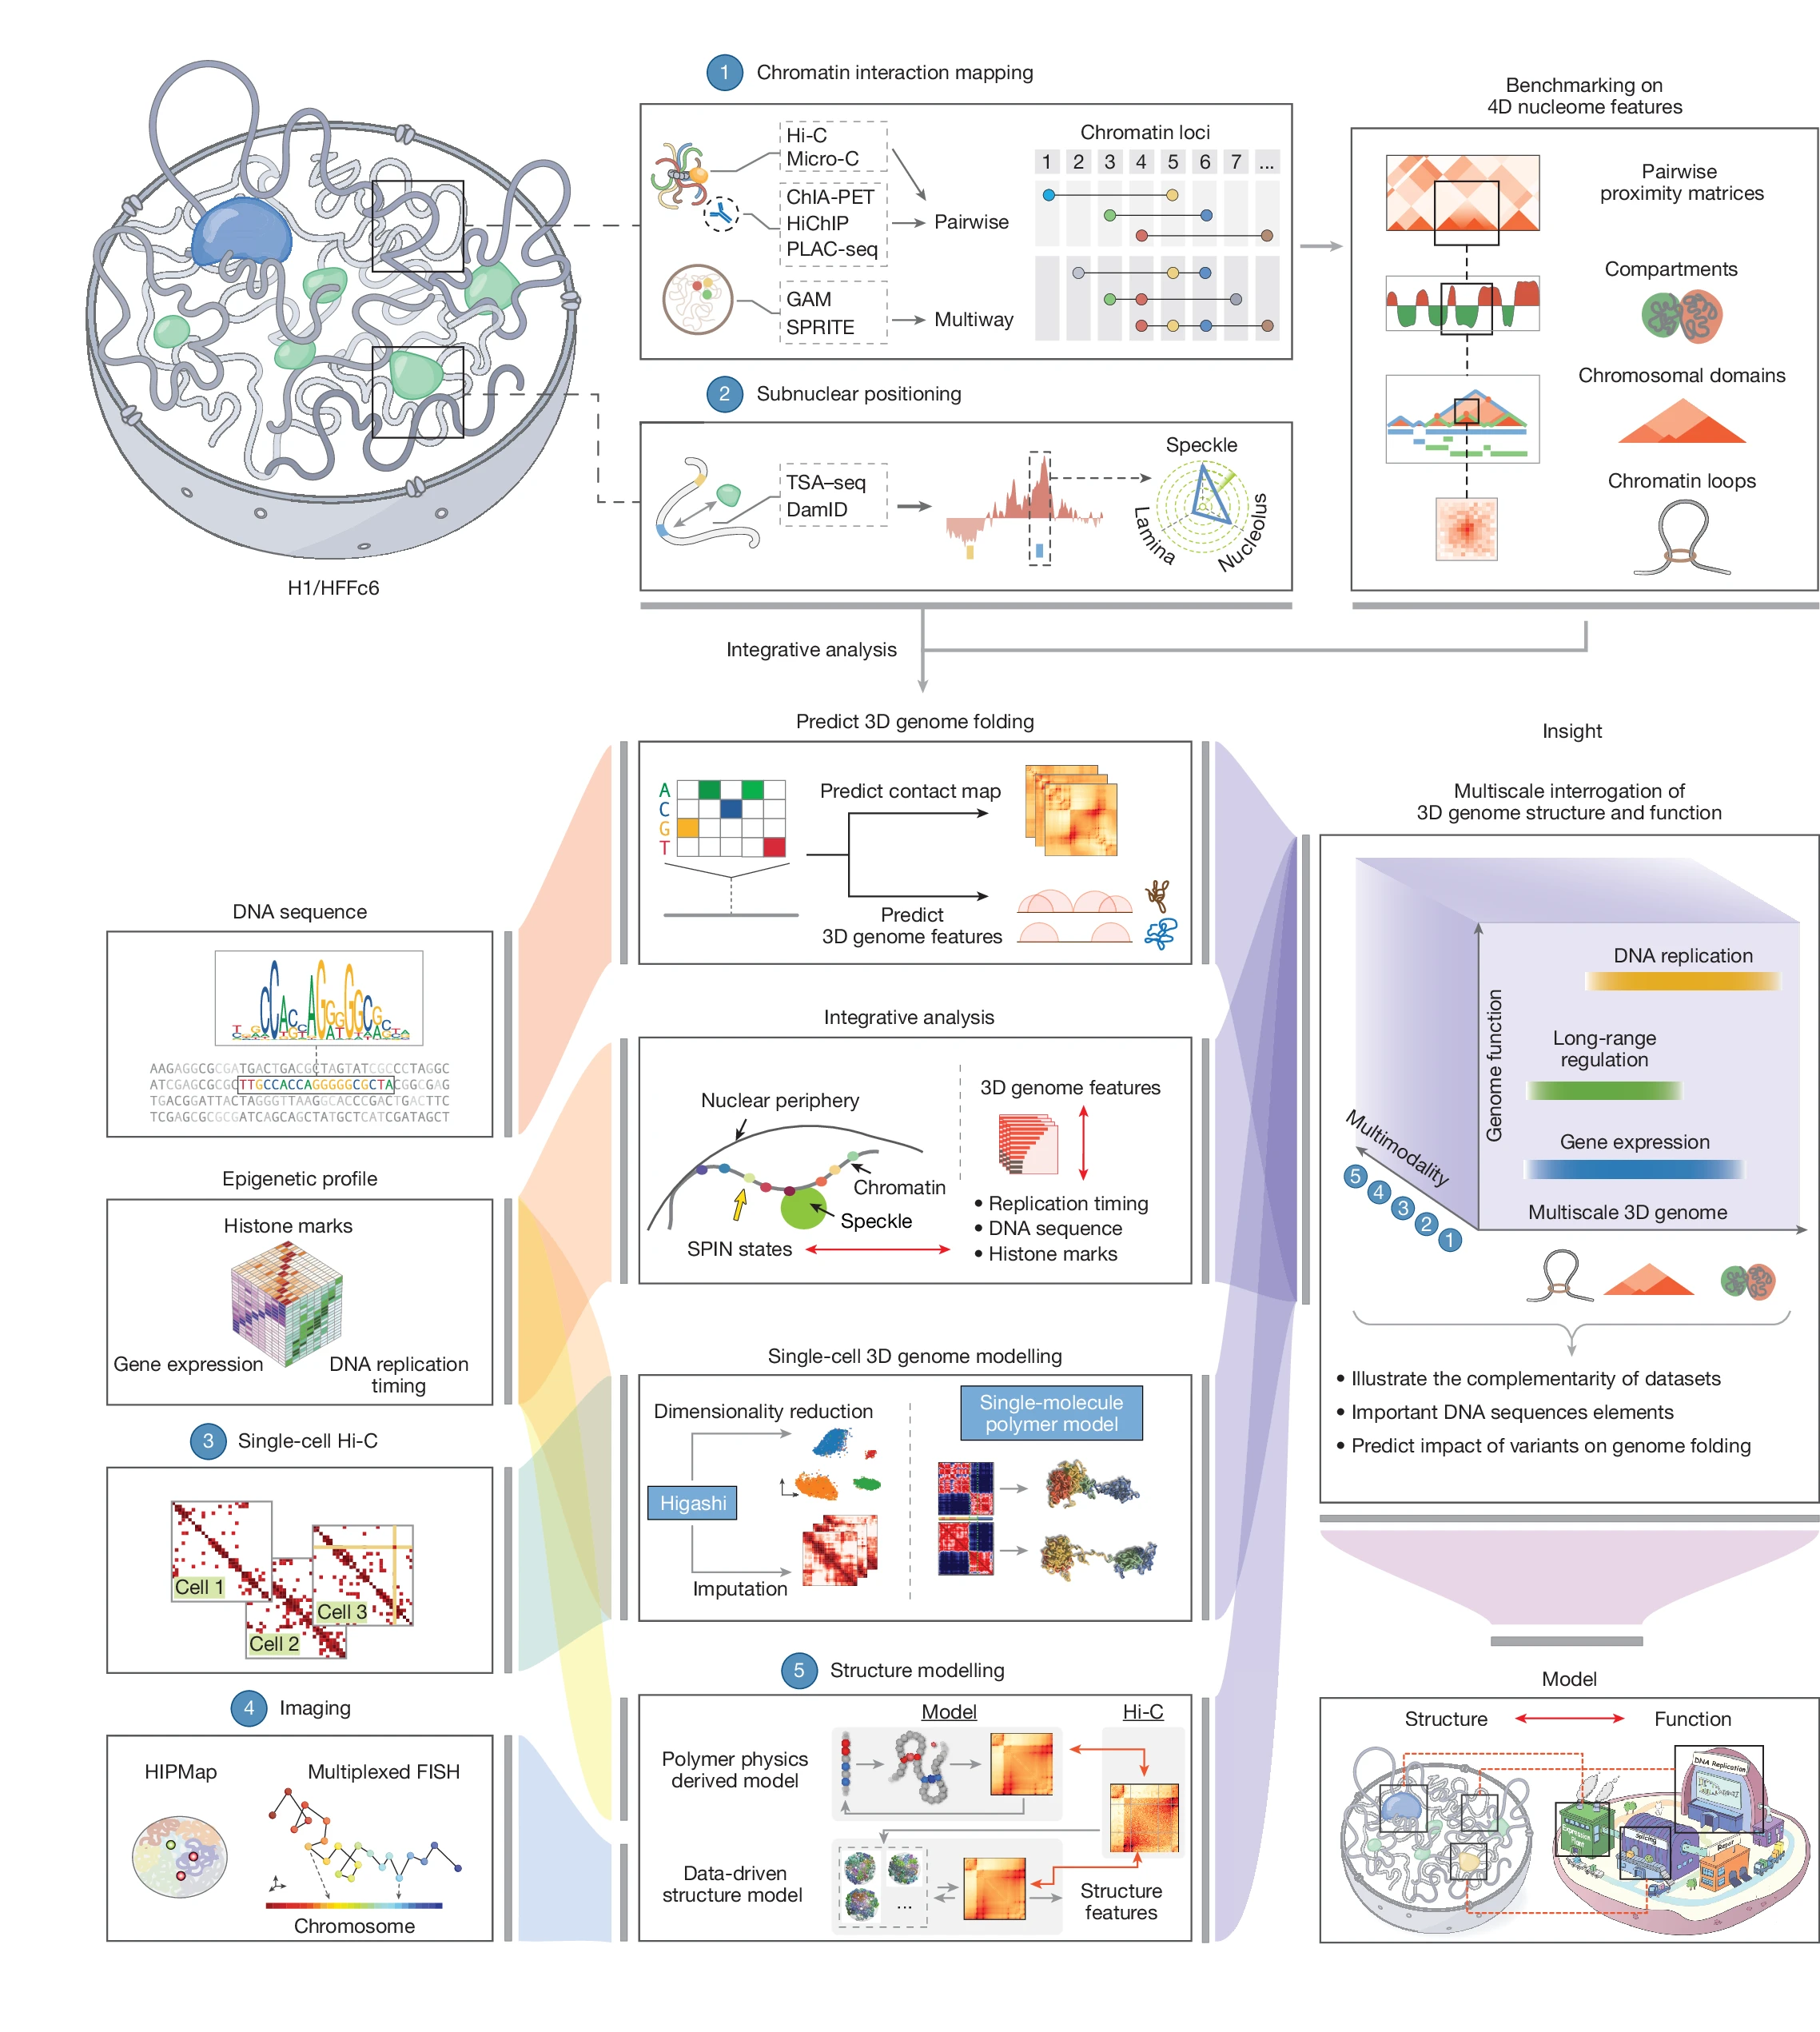
Top left, schematic of the two types of complementary genomic assay for mapping 3D genome folding and the relative distances of genomic loci to nuclear bodies in H1 and HFFc6 cells (top left). Top right, different chromatin interaction mapping methods were compared and benchmarked to assess their ability to identify and quantify 3D genome features at scales ranging from chromatin compartments (megabase) to focally enriched chromatin interactions (kilobase). Bottom left, additional multimodal datasets generated or used to facilitate integrative analyses (see below). HIPmap44, high-throughput imaging position mapping. Bottom middle, multiple integrative modelling and analysis approaches were conducted to reveal the spatial features of chromatin loci by combining 3D genome features and various multimodal datasets. The connections between different input data and integrative analyses is illustrated through colour-coded flow paths. Bottom right, an illustrative cartoon summarizes the overarching aim of the project, which aims to provide insights into structure–function relationships by connecting variable 3D genome features (represented on the x axis) derived from multimodal datasets (y axis) with key cellular functions, such as transcription and replication (z axis). Our models pave the way for identifying the sequence determinants of genome folding and predicting how different variants might influence this folding process. Hi-C contact map examples were drawn using ORCA126.
