
Fig. 2: Microfold cells endogenously arise in bat bronchial organoid-derived ALI cultures.
From: Bat organoids reveal antiviral responses at epithelial surfaces
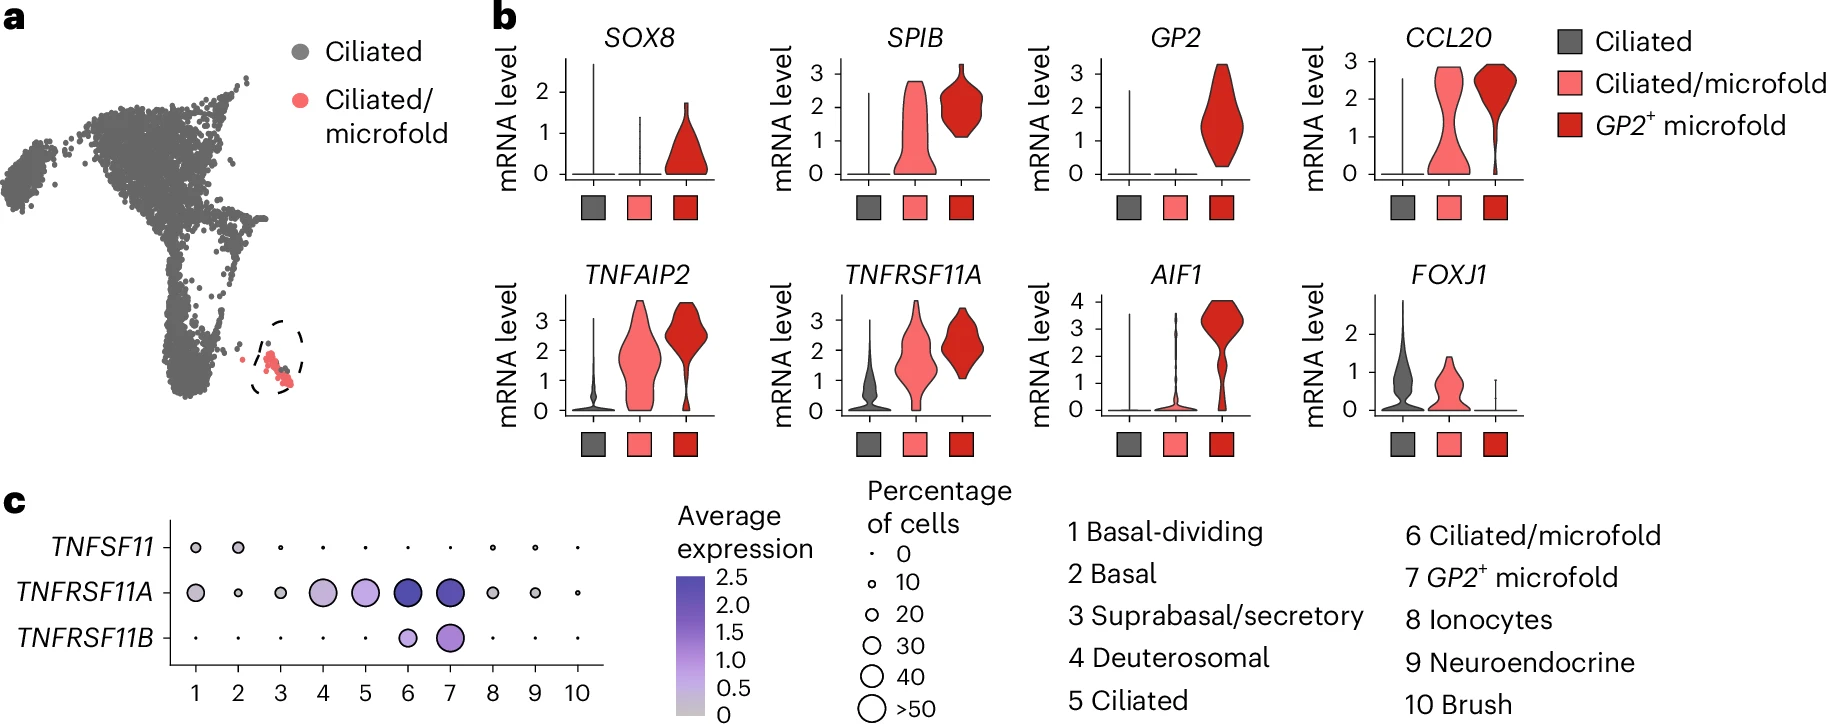
a, UMAP of the integrated R. aegyptiacus-derived nasalALI and bronchialALI scRNA-seq dataset showing the ciliated, and mixed ciliated and microfold, cell clusters. b, Seurat VlnPlot analysis of the microfold cell markers SOX8, SPIB, GP2, TNFAPI2, TNFRSF11A, CCL20, TNFAPI2 and AIF1, and the ciliated cell marker FOXJ1 in ciliated cell, mixed ciliated and microfold cells, and GP2+ microfold cells of R. aegyptiacus-derived bronchialALI. The expression distribution was derived from individual cells. c, Seurat DotPlot showing the average expression of receptor–ligand pair markers for the RANK–RANKL signaling axis (TNFSF11, TNFRSF11A and TNFRSF11B) for clusters 1–10 in the R. aegyptiacus-derived bronchialALI scRNA-seq dataset. The dot size represents the percentage of an individual cell type expressing a given marker. Color intensity represents the average expression value. Dot size was set to a maximum percentage of 50%. (Genes expressed by more than 50% of cells have the same dot size.)
