
Figure 4
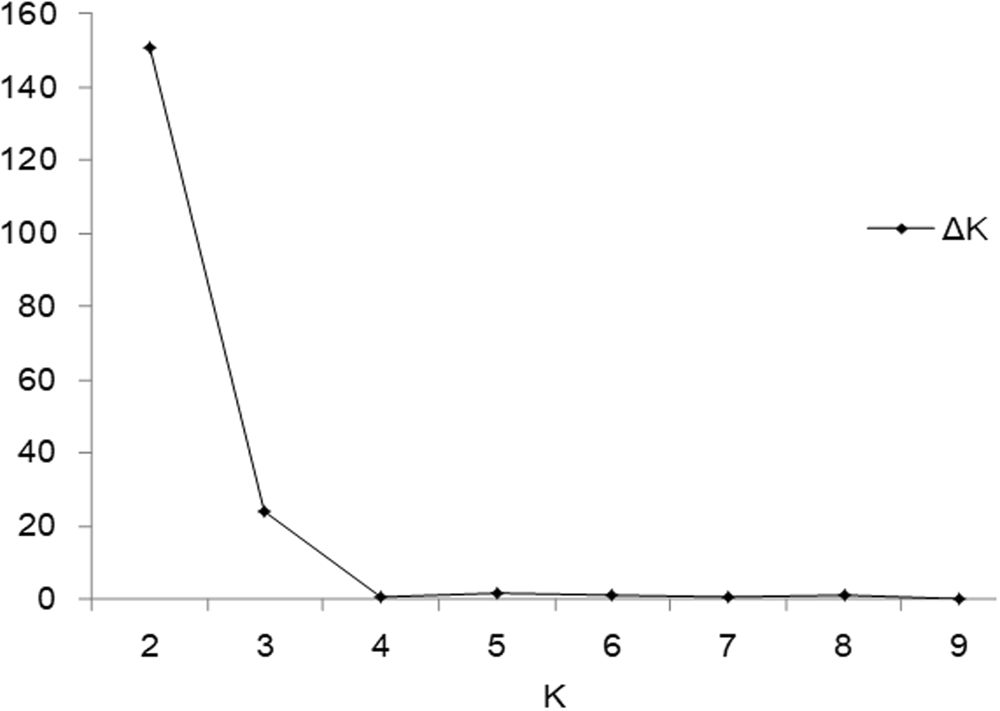
∆K based on the rate of change of LnP(D) between successive K. The value of ΔK reached the highest (150.957) when K = 2, indicating that 320 peanut accessions should be divided into two subgroups ∆K and reached the second largest value (23.720) with K = 3.
