
Figure 1
From: Defining a historic football team: Using Network Science to analyze Guardiola’s F.C. Barcelona
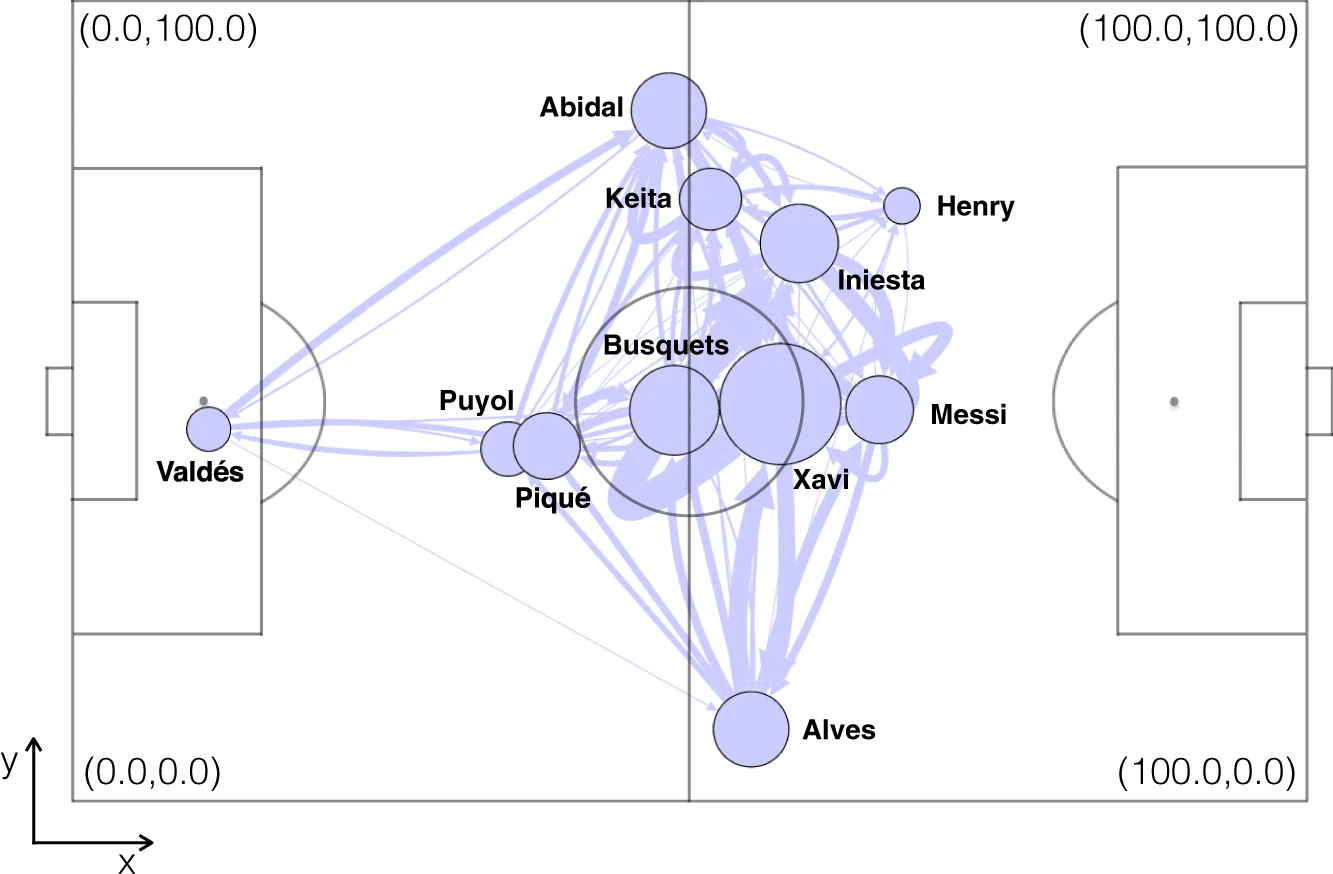
Schematic illustration of a football passing network. In the plot, players are represented by circular nodes, whose size is proportional to their eigenvector centrality, a mesure of importance in the network structure. The position of each player is given by the average of the positions of all passes made by the player along the match. The width of the links is proportional to their weights, which account for the number of passes between players. Note that links are unidirectional. In this example, we plot the average passing network of the match between F.C. Barcelona and Real Madrid, played during the season 2009/2010 at Santiago Bernabeu Stadium. Datasets leading to the passing network were provided by Opta.
