
Figure 1
From: Landscape of heart proteome changes in a diet-induced obesity model
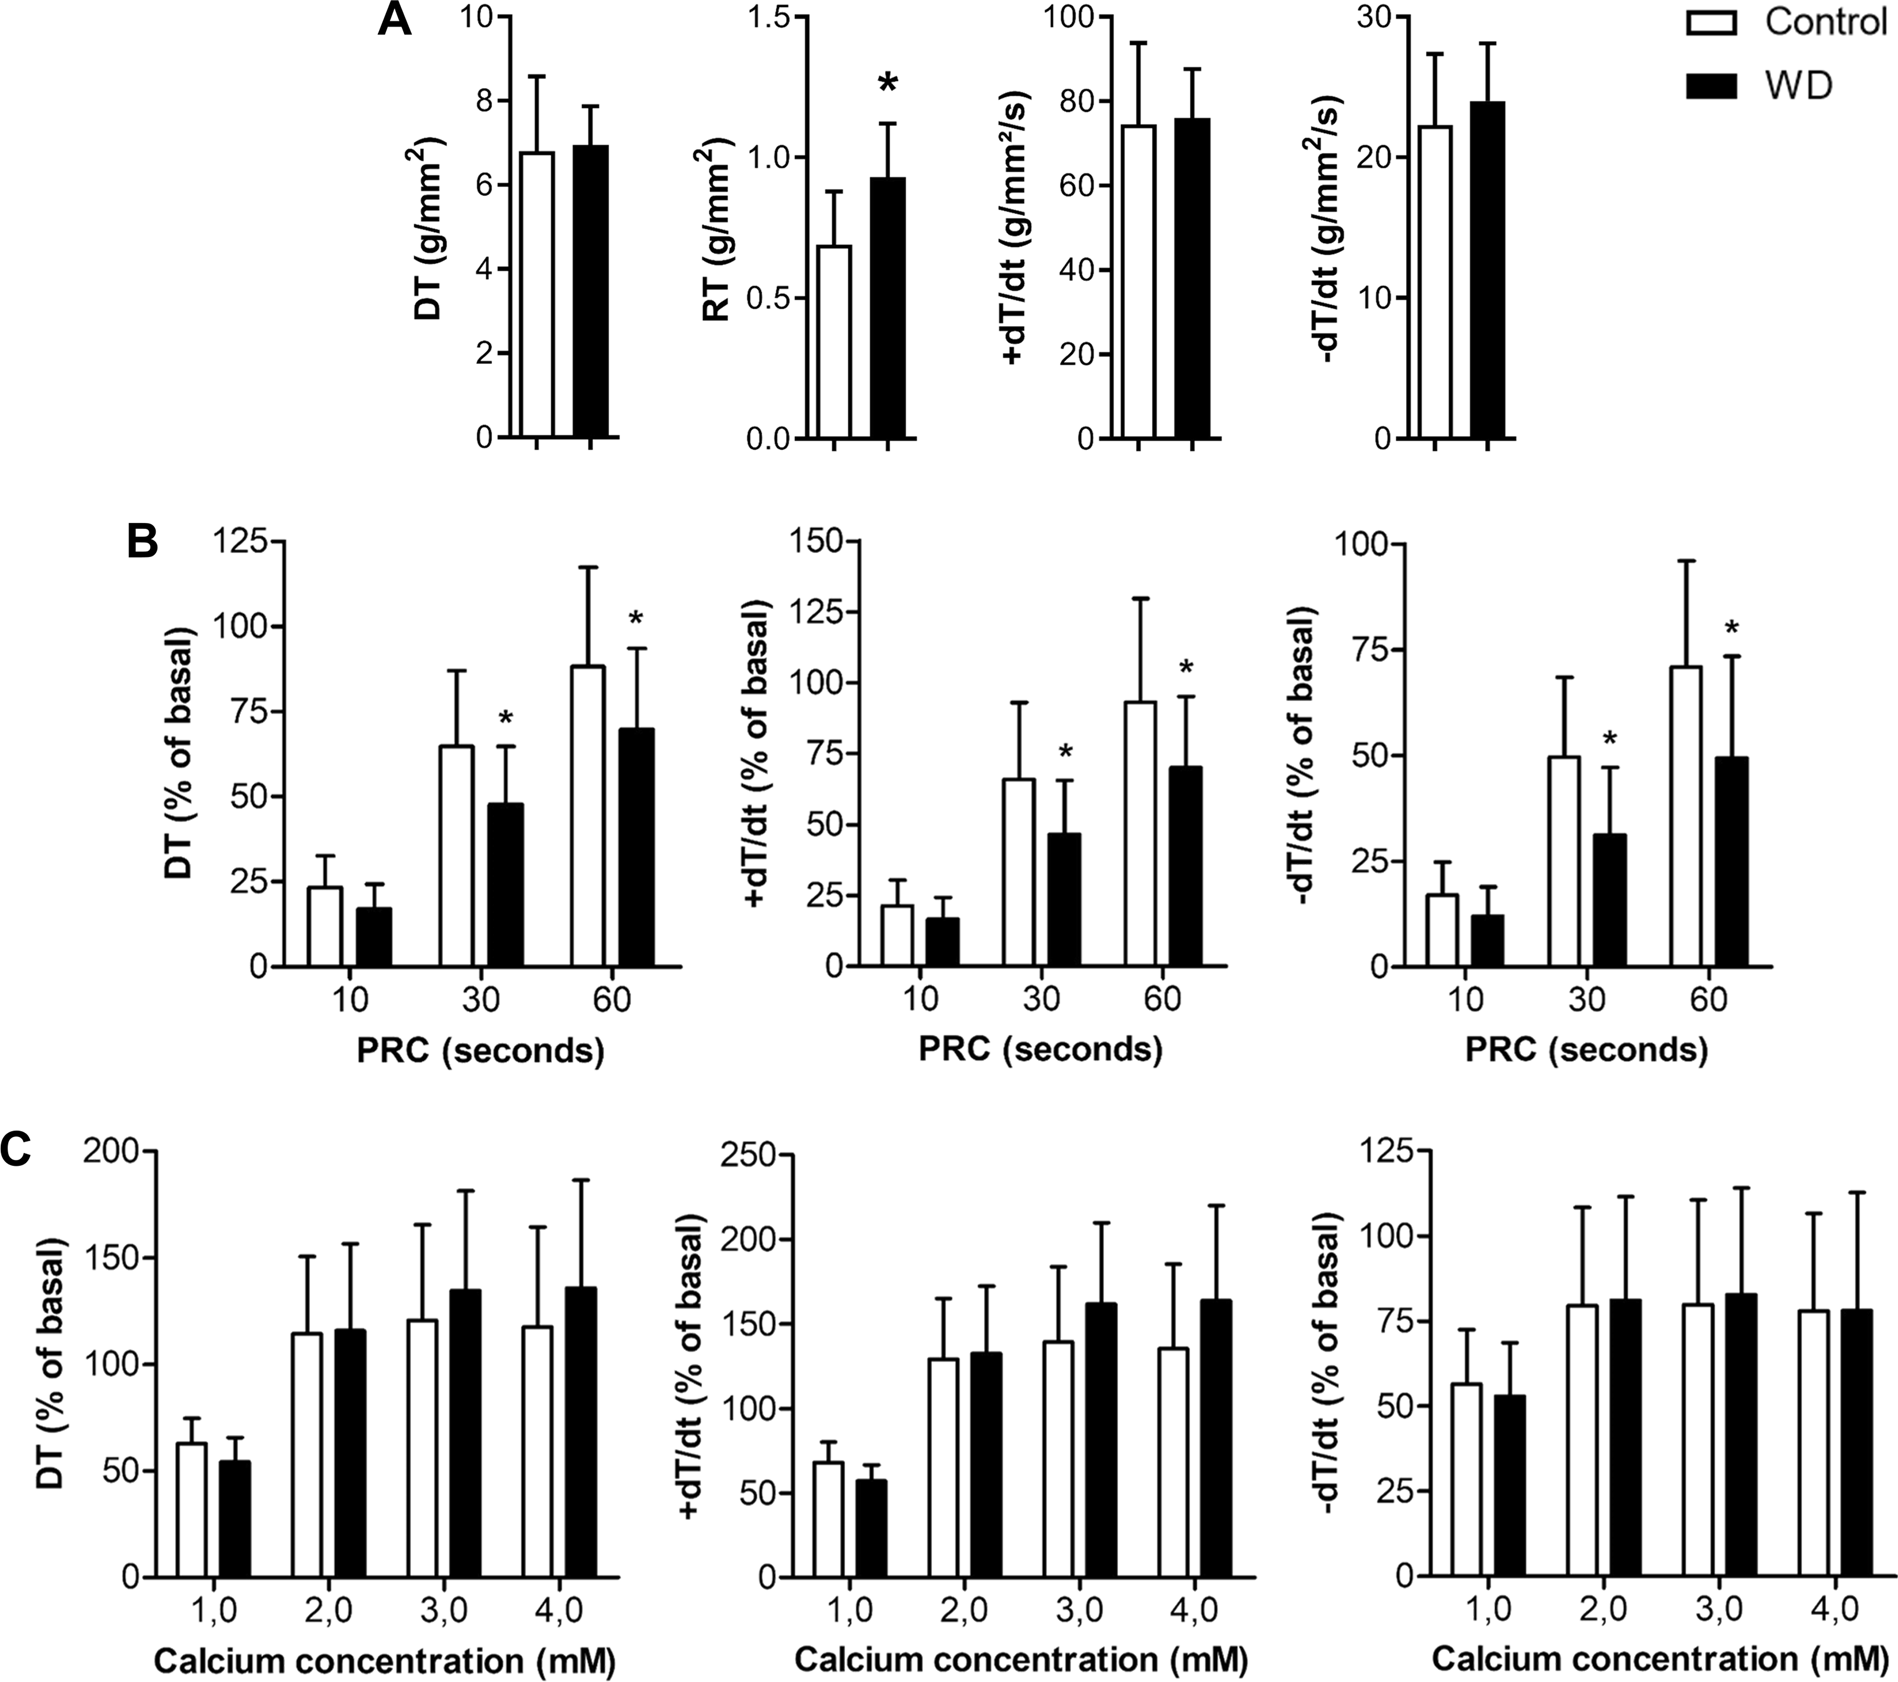
Left ventricular papillary muscle study. (A) Baseline condition, (B) post‐rest contraction and (C) effects of increasing extracellular Ca2+ concentration in isolated papillary muscle from control and Western diet (WD) groups (n = 11/group). DT, developed tension (g/mm2); RT, resting tension (g/mm2); +dT/dt, peak of positive tension derivatives (g/mm2/sec); −dT/dt, peak of negative tension derivatives (g/mm2/sec). All parameters normalized per cross-sectional area. Data are means ± SD. Student’s t-test for independent samples in (A) and repeated-measures two-way ANOVA and Bonferroni post hoc test in (B) and (C). *p < 0.05 vs. control.
