
Figure 2
From: Hair cortisol concentrations are associated with hippocampal subregional volumes in children
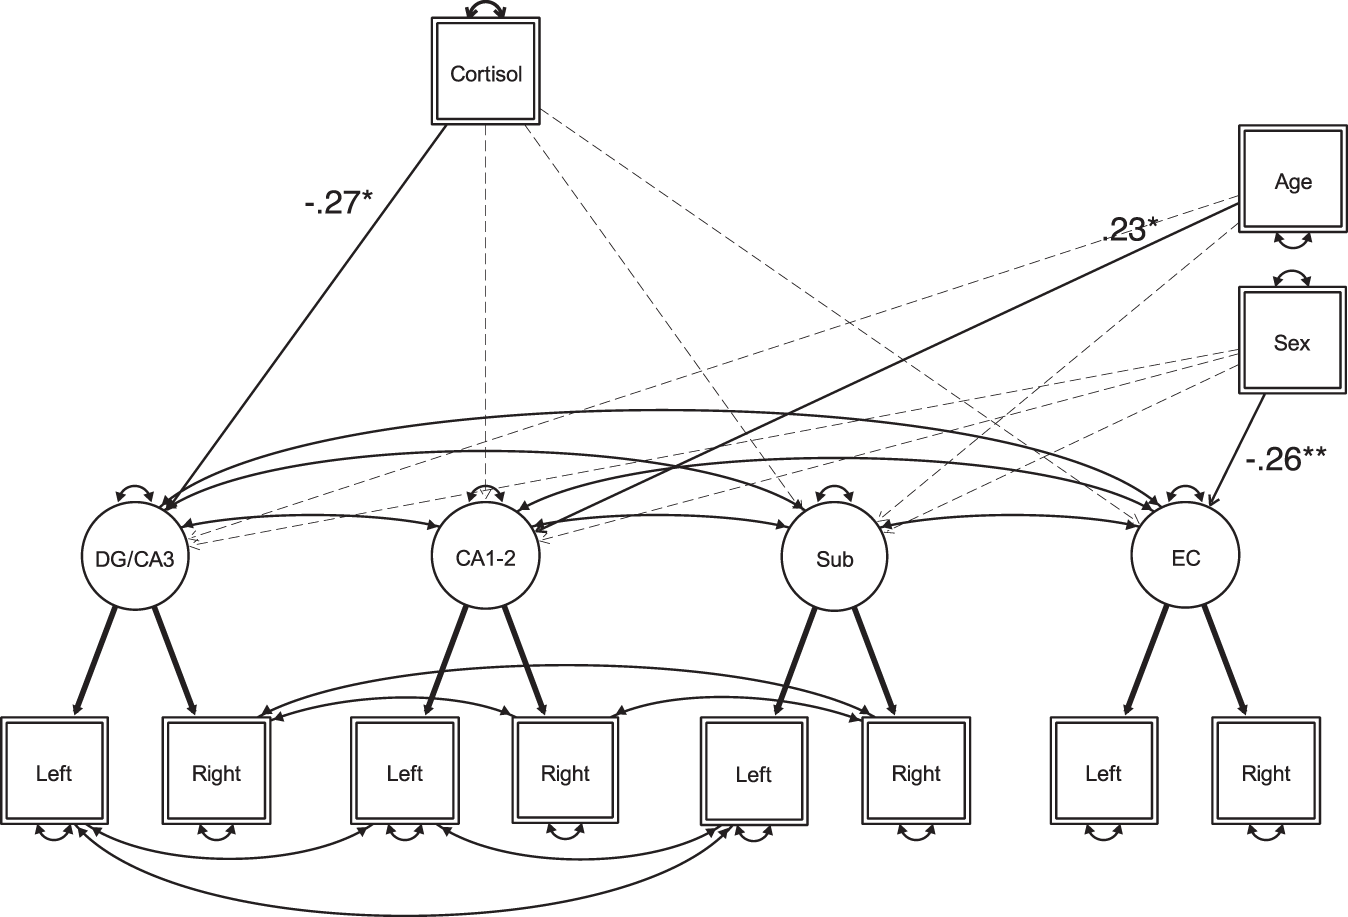
Schematic illustration of the hippocampal measurement model with regressions of hair cortisol concentrations (Cortisol), and covariates (Age and Sex) on hippocampal subfield volumes. DG/CA3: dentate gyrus–CA3, Sub: Subiculum: EC: Entorhinal cortex. Observed and latent variables are represented with rectangles and circles, respectively. Significant regression paths are shown as solid lines (with arrowhead) labeled with standardized parameter estimates. Non-significant paths are shown as dashed lines (with arrowhead). Estimated variances and covariances are also shown as solid lines. Thick solid lines represent path values fixed at 1. All parameter estimates are shown separately in Table 2, for better readability of the figure.
