
Figure 2
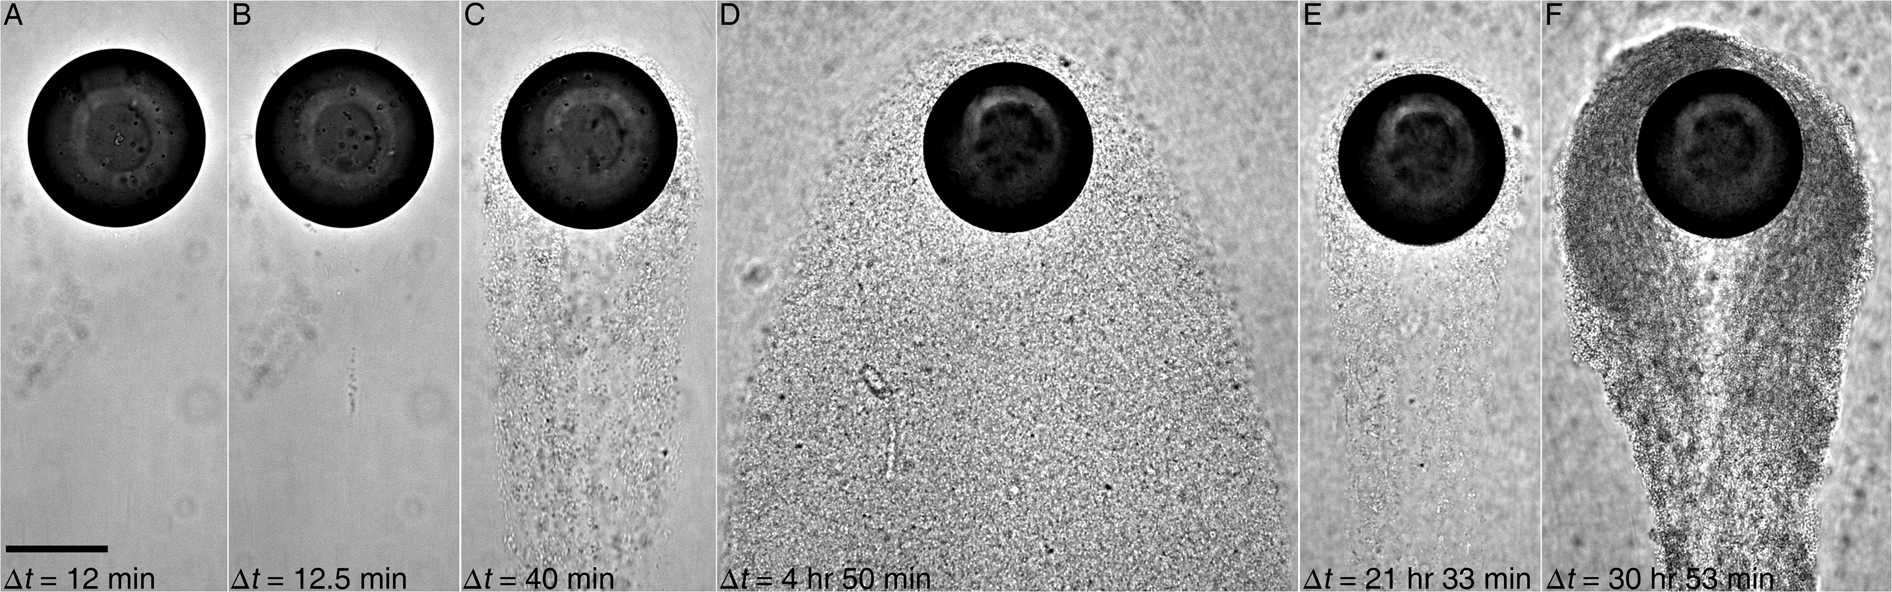
Micrographs of a crude oil drop in a flow containing Pseudomonas sp. (P62) at various times immediately after its exposure to bacterial suspension, Δt, of (A) 12 min, (B) 12.5 min, (C) 40 min, (D) 4 h 50 min, (E) 21 h 33 min, and (F) 30 h 53 min. They show stages of EPS streamers around an oil drop as (A) smooth drop, (B) streamer initiation, (C) bundling, (D) proliferation and aggregation, (E) dispersal, and (F) reformation. The flow (\(R{e}_{{D}_{d}}=0.4\)) is downward in all panels. Scale: 100 μm.
