
Figure 1
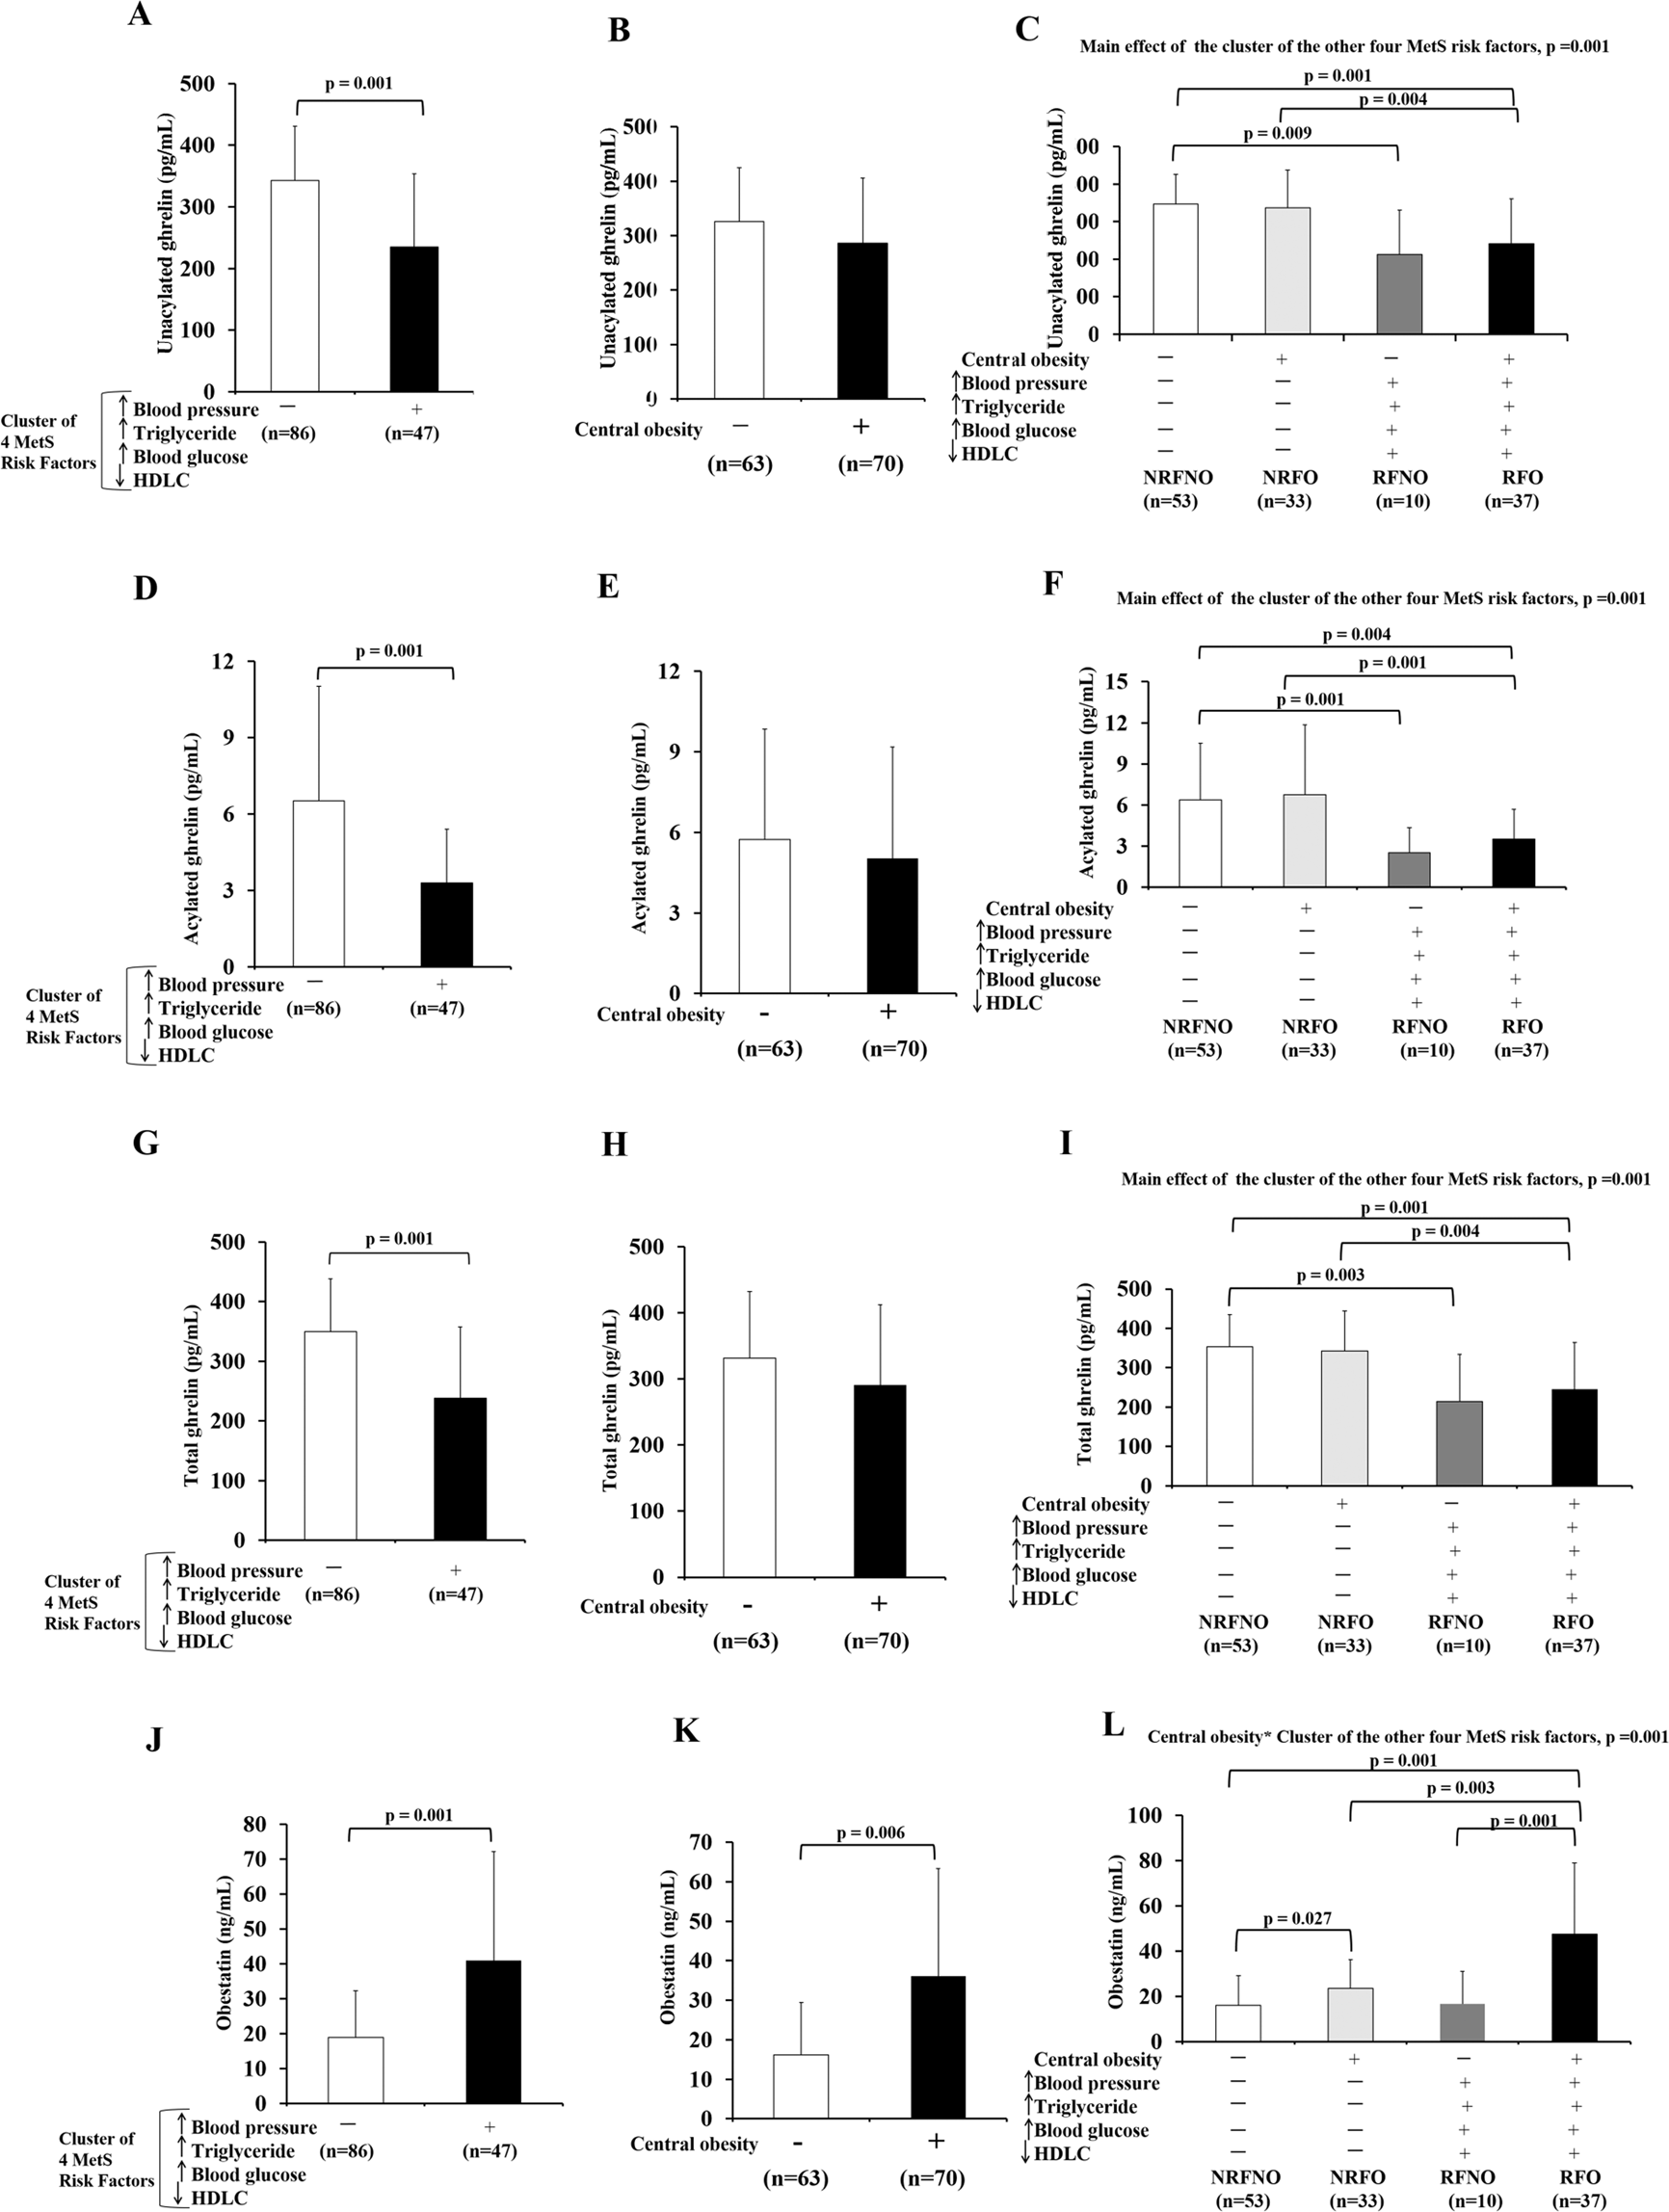
Levels of ghrelin gene products in response to CO or the cluster of the other four MetS risk factors alone as well as CO in conjunction with the cluster of the other four MetS risk factors. Unacylated ghrelin, acylated ghrelin and total ghrelin levels of subjects with/without the cluster of four MetS risk factors regardless of the status of CO (RFNO and RFO vs NRFNO and NRFO) (A,D,G). Unacylated ghrelin, acylated ghrelin and total ghrelin levels of subjects with/without CO regardless of the status of the cluster of four MetS risk factors (NRFNO and RFNO vs NRFO and RFO) (B,E,H). Comparison of unacylated ghrelin, acylated ghrelin and total ghrelin levels among subjects with no MetS risk factors, central obese only, the cluster of the other MetS risk factors other than central obese, and all MetS risk factors (C,F,I). Obestatin levels of subjects with/without the cluster of four MetS risk factors regardless of the status of CO (RFNO and RFO vs NRFNO and NRFO) (J). Obestatin levels of subjects with/without CO regardless of the status of the cluster of four MetS risk factors (NRFNO and RFNO vs NRFO and RFO) (K). Comparison of obestatin among subjects with no MetS risk factors (NRFNO), central obese only (NRFO), the cluster of the other MetS risk factors other than central obese (RFNO), and all MetS risk factors (RFO) (L).
