
Figure 5
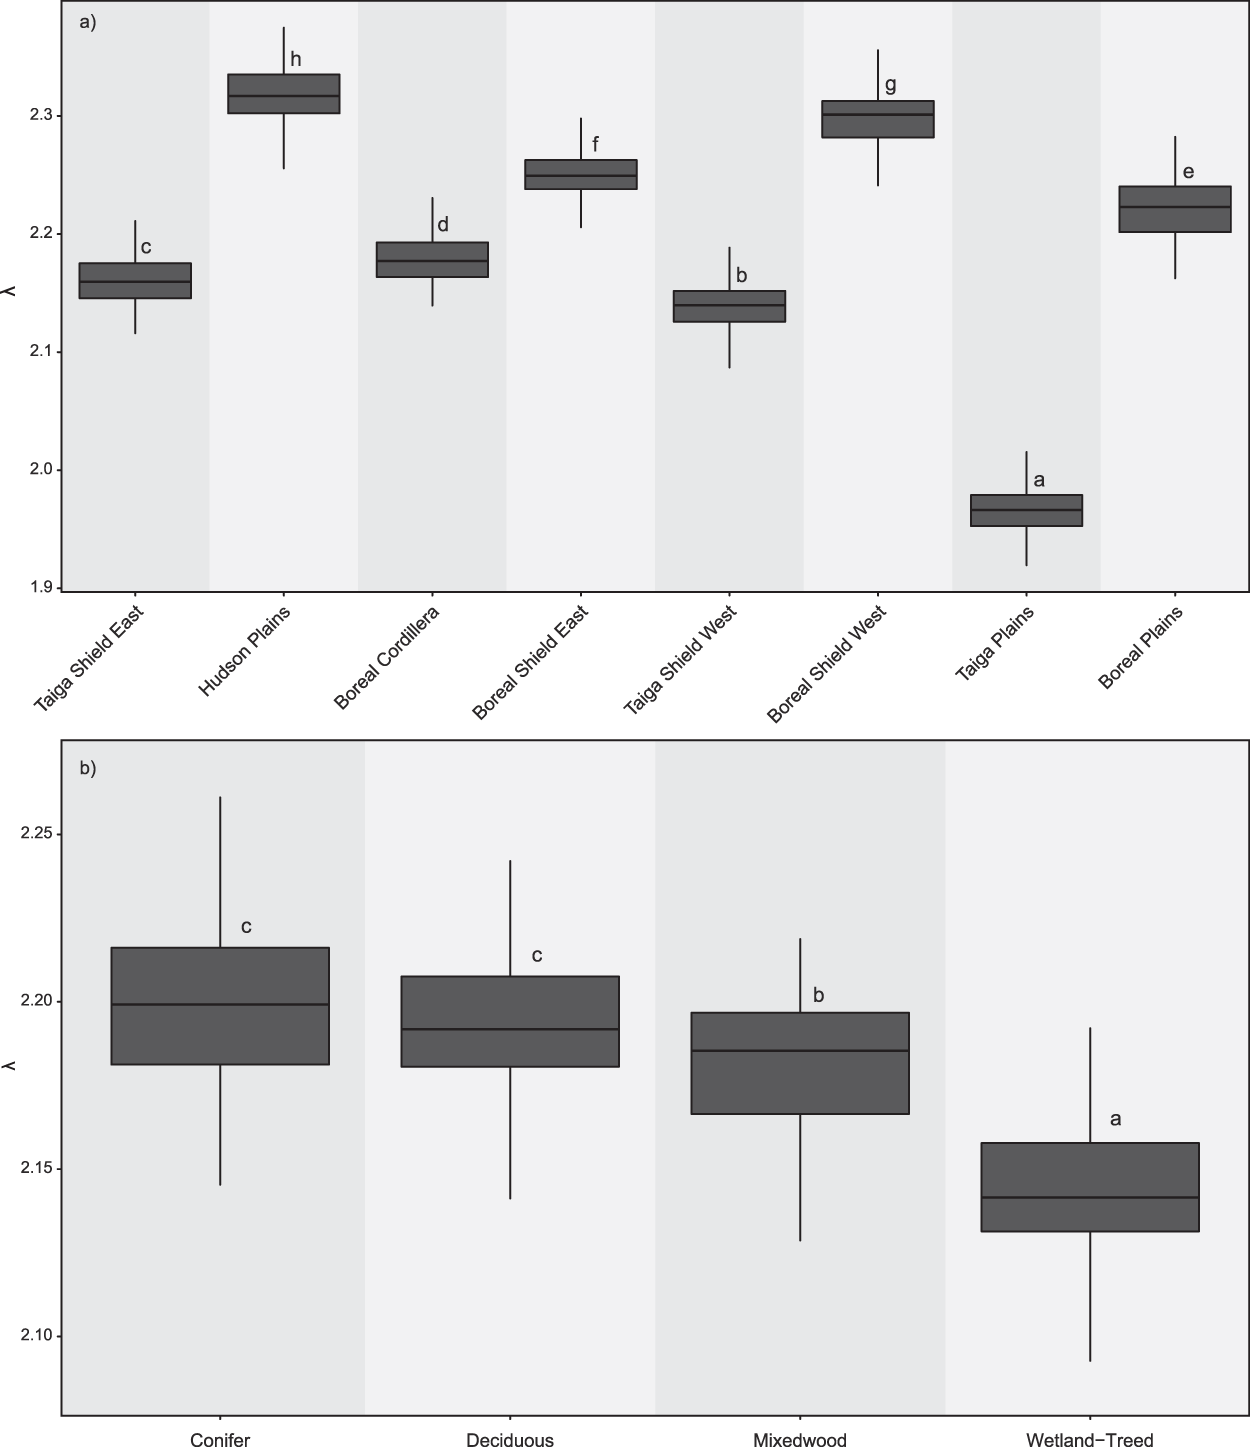
Comparison of bootstrapped distributions of λ for (a) ecozone (Boreal Cordillera (BC), Boreal Plains (BP), Boreal Shield East (BSE), Boreal Shield West (BSW), Hudson Plain (HP), Taiga Plain (TP), Taiga Shield East (TSE), and Taiga Shield West (TSW)), and (b) forest type (Coniferous (C), Deciduous (D), Mixedwood (M), and Wetland-treed (WT). Letters above boxplots indicate Dunn’s post-hoc test results denoting whether distributions were significantly different (a = 0.05).
