
Figure 2
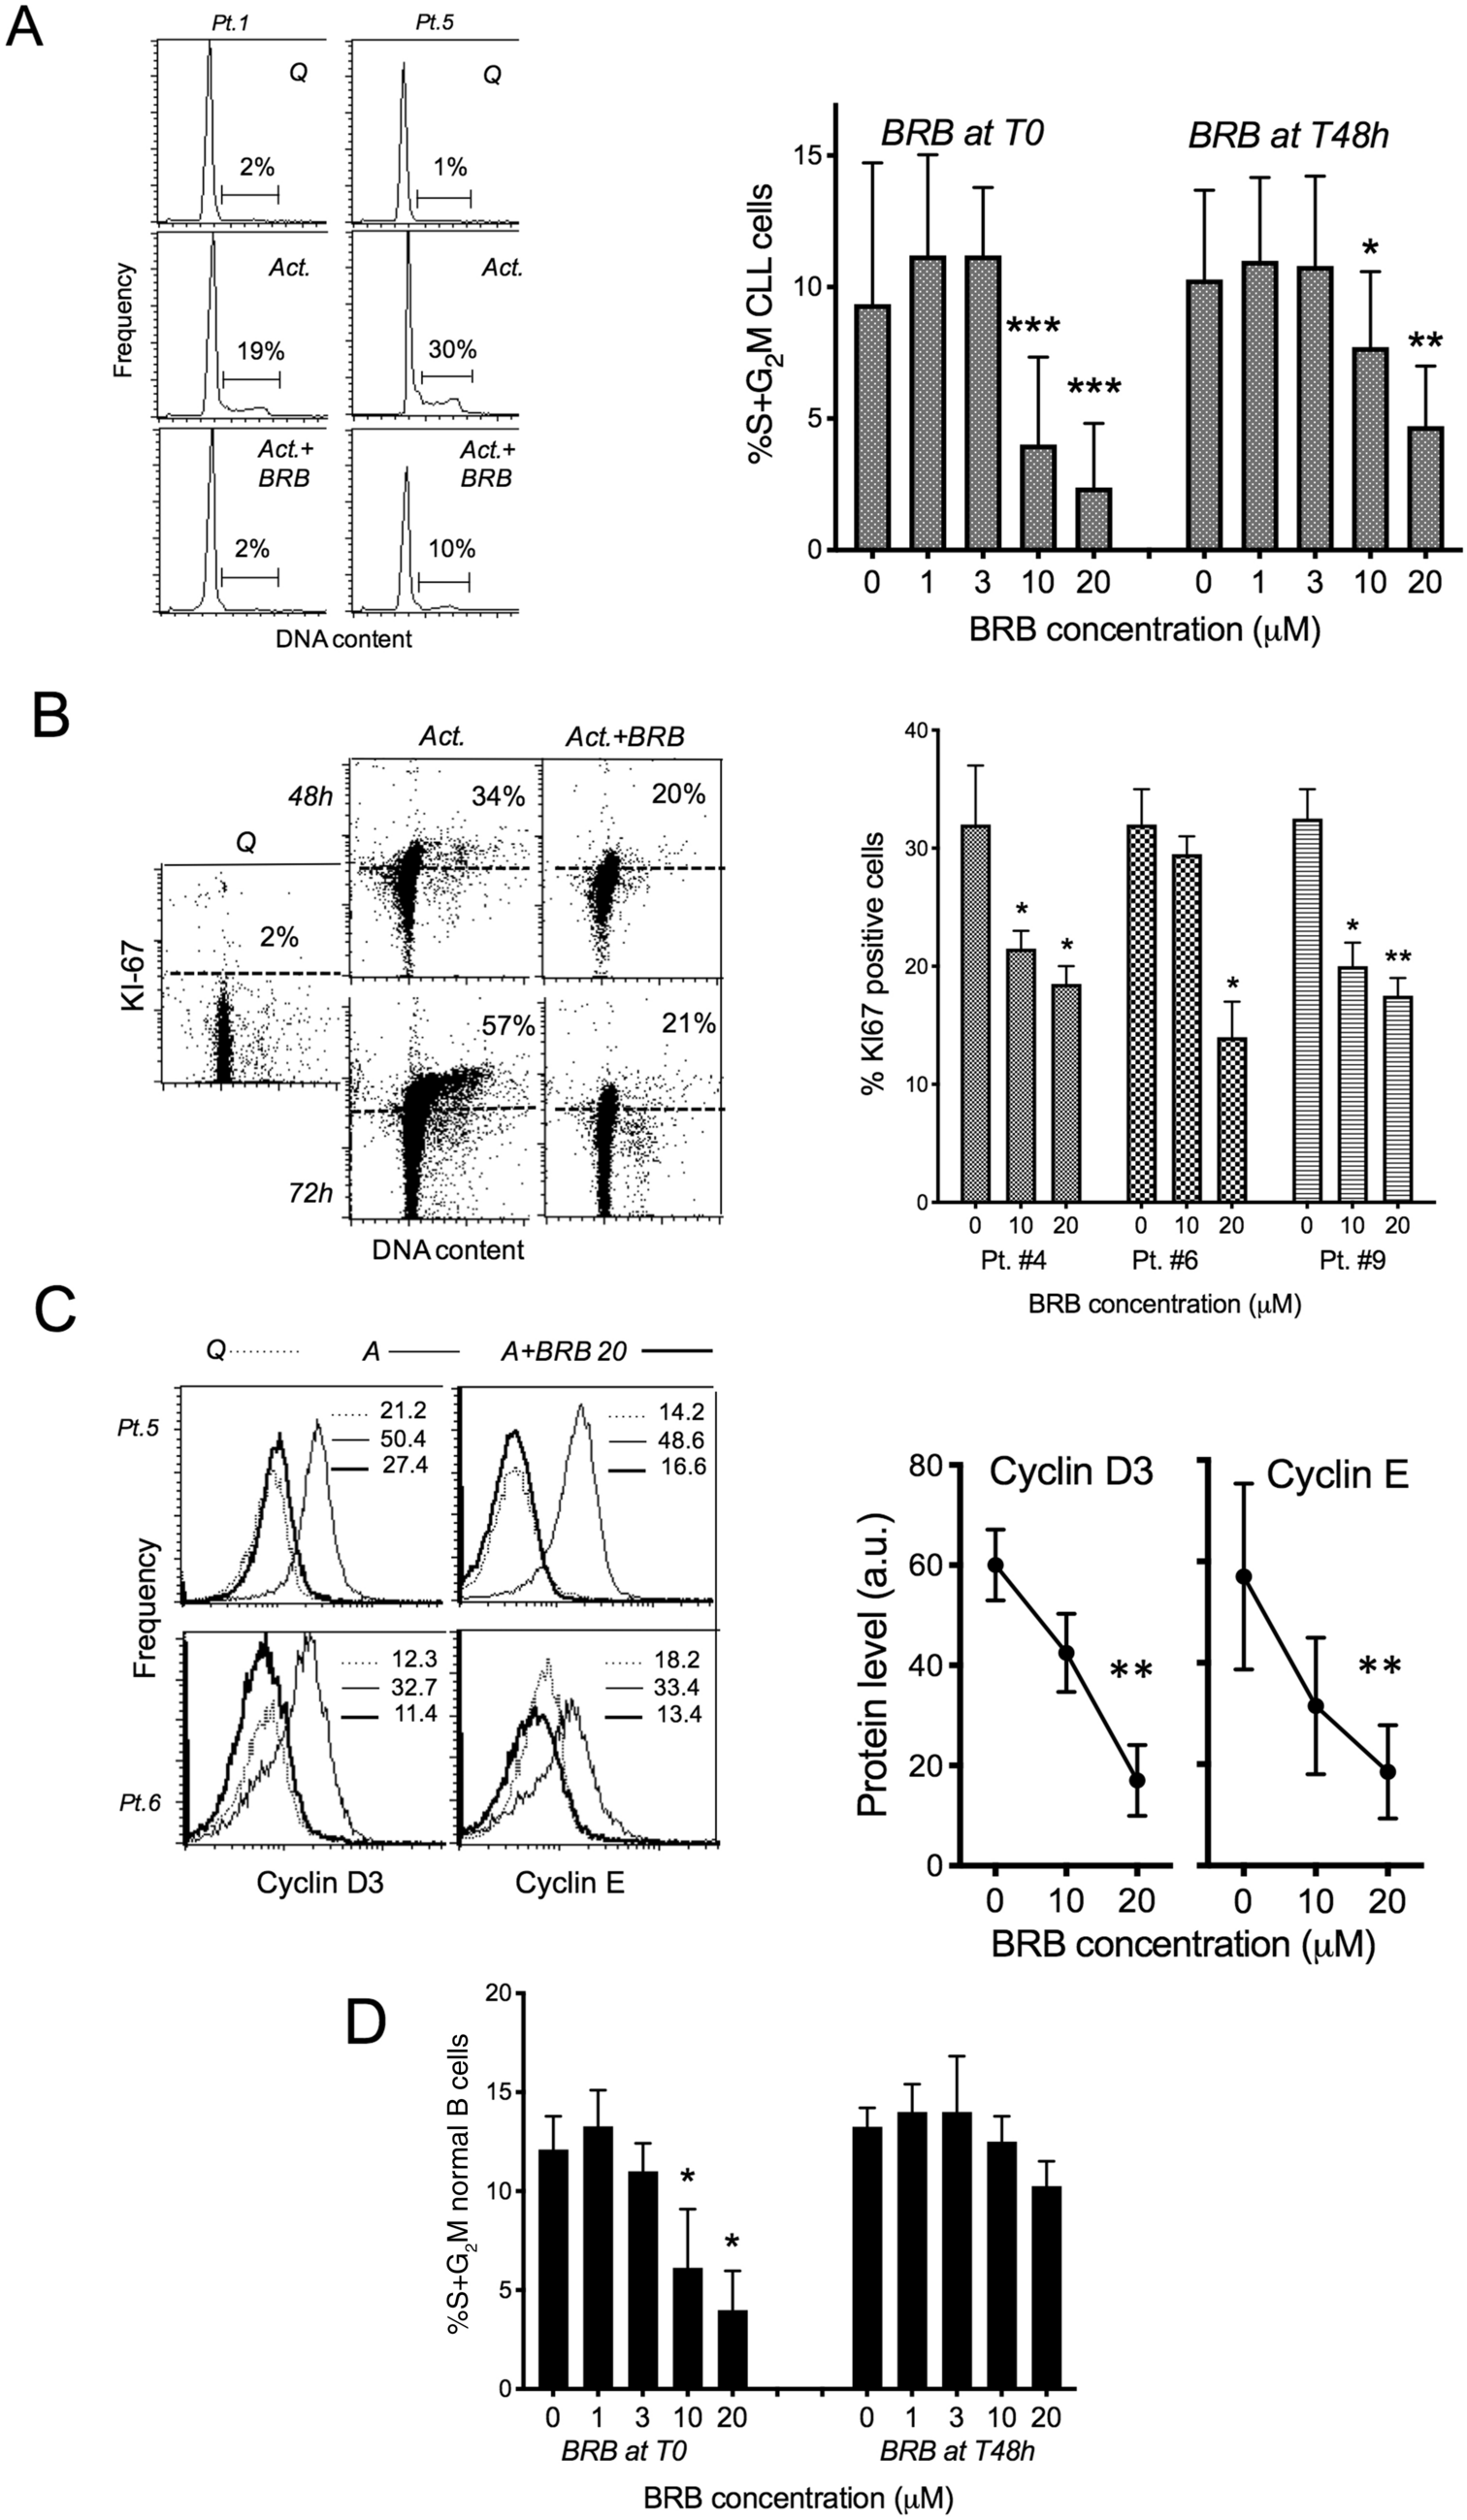
BRB affects CLL cell activation and cell cycle entry. (A) Left: flow cytometric DNA content histograms of leukemic cells from one CLL patient with mutated TP53. The cells were either quiescent or stimulated by CpG/ODN2006 + IL-15 and treated with BRB 20 μM for 48 h. Drug treatment of activated cells started simultaneously with stimulation. Right: Percentage of CLL cells in the S + G2M phase of the cell cycle, evaluated from flow cytometric DNA content histograms of samples from 17 CLL patients, stimulated and treated with BRB for 48 h. BRB treatment started at the time of stimulation (T0), or 48 h after stimulation (T48h). Statistical significance of differences by non-parametric t-test. *P ≤ 0.05; **P ≤ 0.01; ***P ≤ 0.001. (B) Left: flow cytometric DNA/KI67 bivariate plots of leukemic cells from one CLL patient with mutated SF3B1, treated with 20 μM BRB at the time of CpG + IL-15 stimulus and analyzed after 48 and 72 h. Right: Percentage of Ki-67 positive cells in leukemic cell cultures of three CLL patients, evaluated from flow cytometric DNA/KI67 bivariate plots of samples stimulated and treated simultaneously with BRB for 48 h. Statistical significance of differences by non-parametric t-test. *P ≤ 0.05; **P ≤ 0.01. (C) Left: frequency histograms of cyclin D3 and cyclin E expression in leukemic cells from two CLL patients, either quiescent or stimulated by CpG/ODN2006 + IL-15 and treated with BRB 20 μM for 48 h. Right: Percentage of cyclin D3 and cyclin E positive cells in CLL cultures stimulated and treated simultaneously with BRB for 48 h. Cells were processed for intracellular immunofluorescence and analyzed by flow cytometry within the ‘live’ gate. Statistical significance of differences by non-parametric t-test. **P ≤ 0.01. (D) Percentage of normal B lymphocytes residing in the S + G2M phase of the cell cycle, evaluated from flow cytometric DNA content histograms of samples from 6 healthy donors. Cells were stimulated and treated for 48 h with BRB either at beginning of stimulation (T0) or 48 h after stimulation (T48). Statistical significance of differences by non-parametric t-test. *P ≤ 0.05.
