
Figure 1
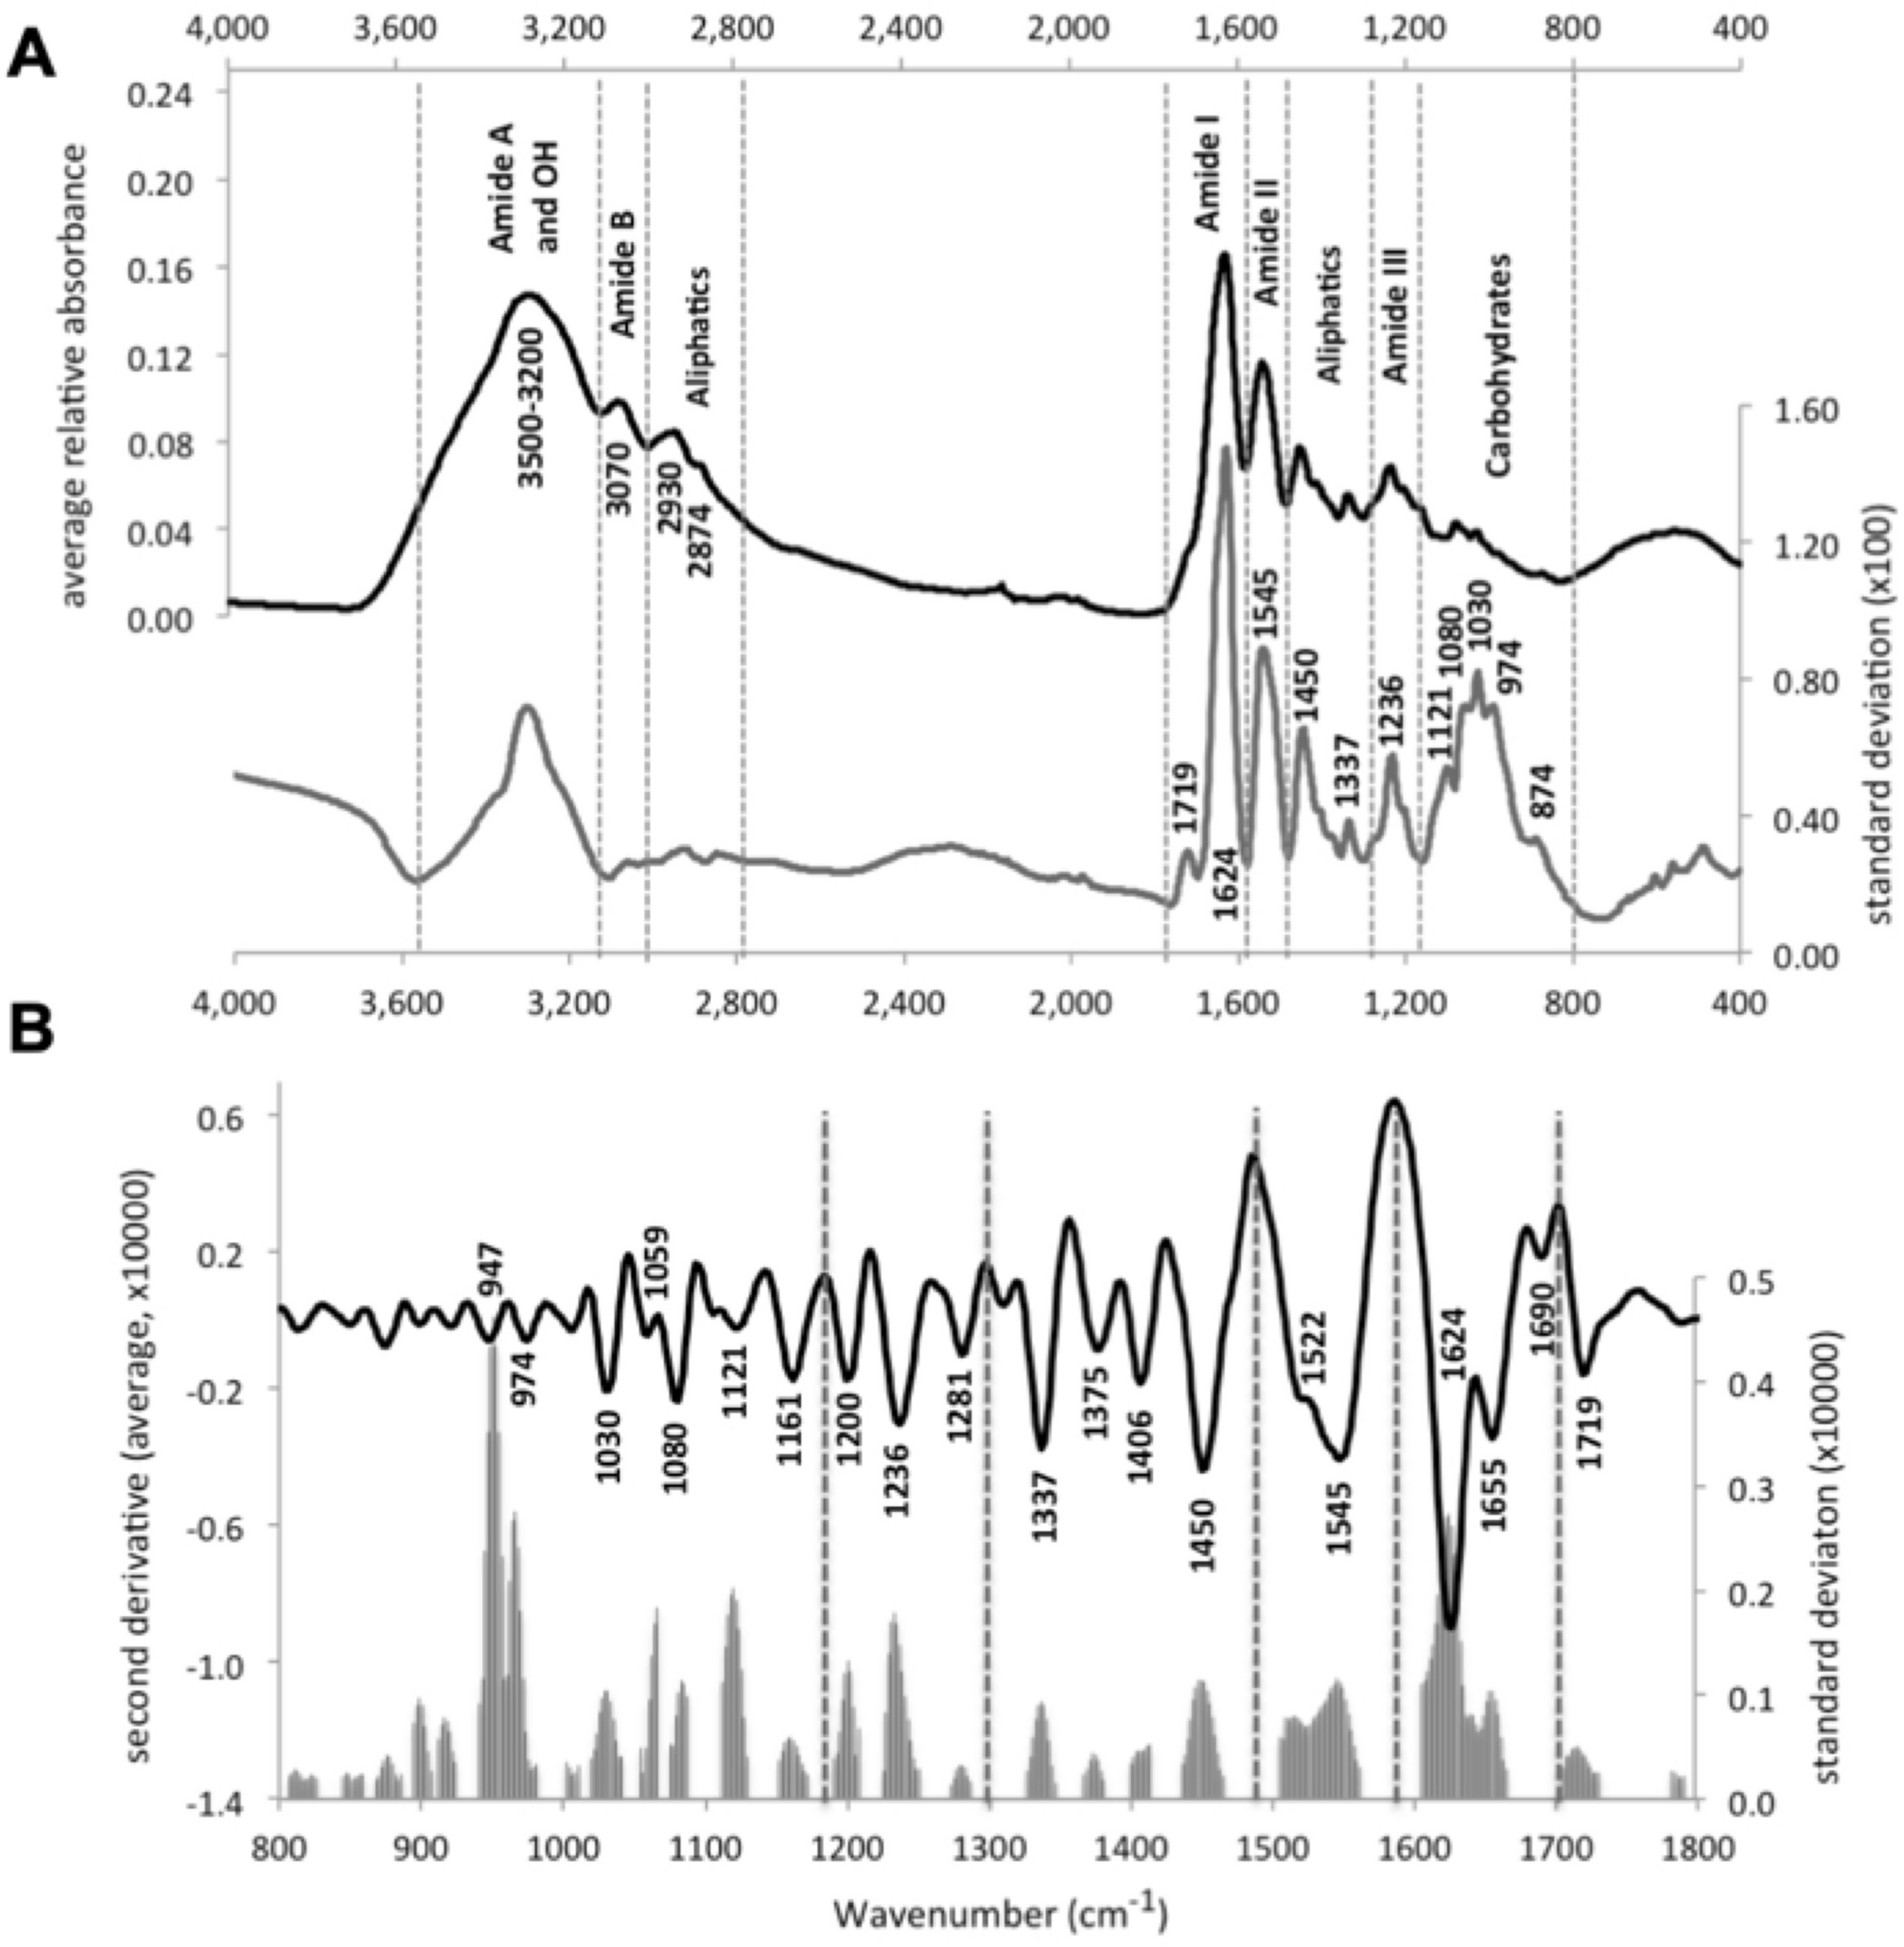
(A) Average (black line) and standard deviation (grey line) mid infrared FTIR-ATR spectra of the whole set of collagen samples analysed in this study. (B) Average spectrum of the second derivative spectra of the analysed samples in the 1800–800 cm−1 region; grey bars correspond to the standard deviation of the main absorptions. Vertical dashed lines separate the main collagen spectral regions (see “Collagen FTIR-ATR spectra” section).
