
Figure 7
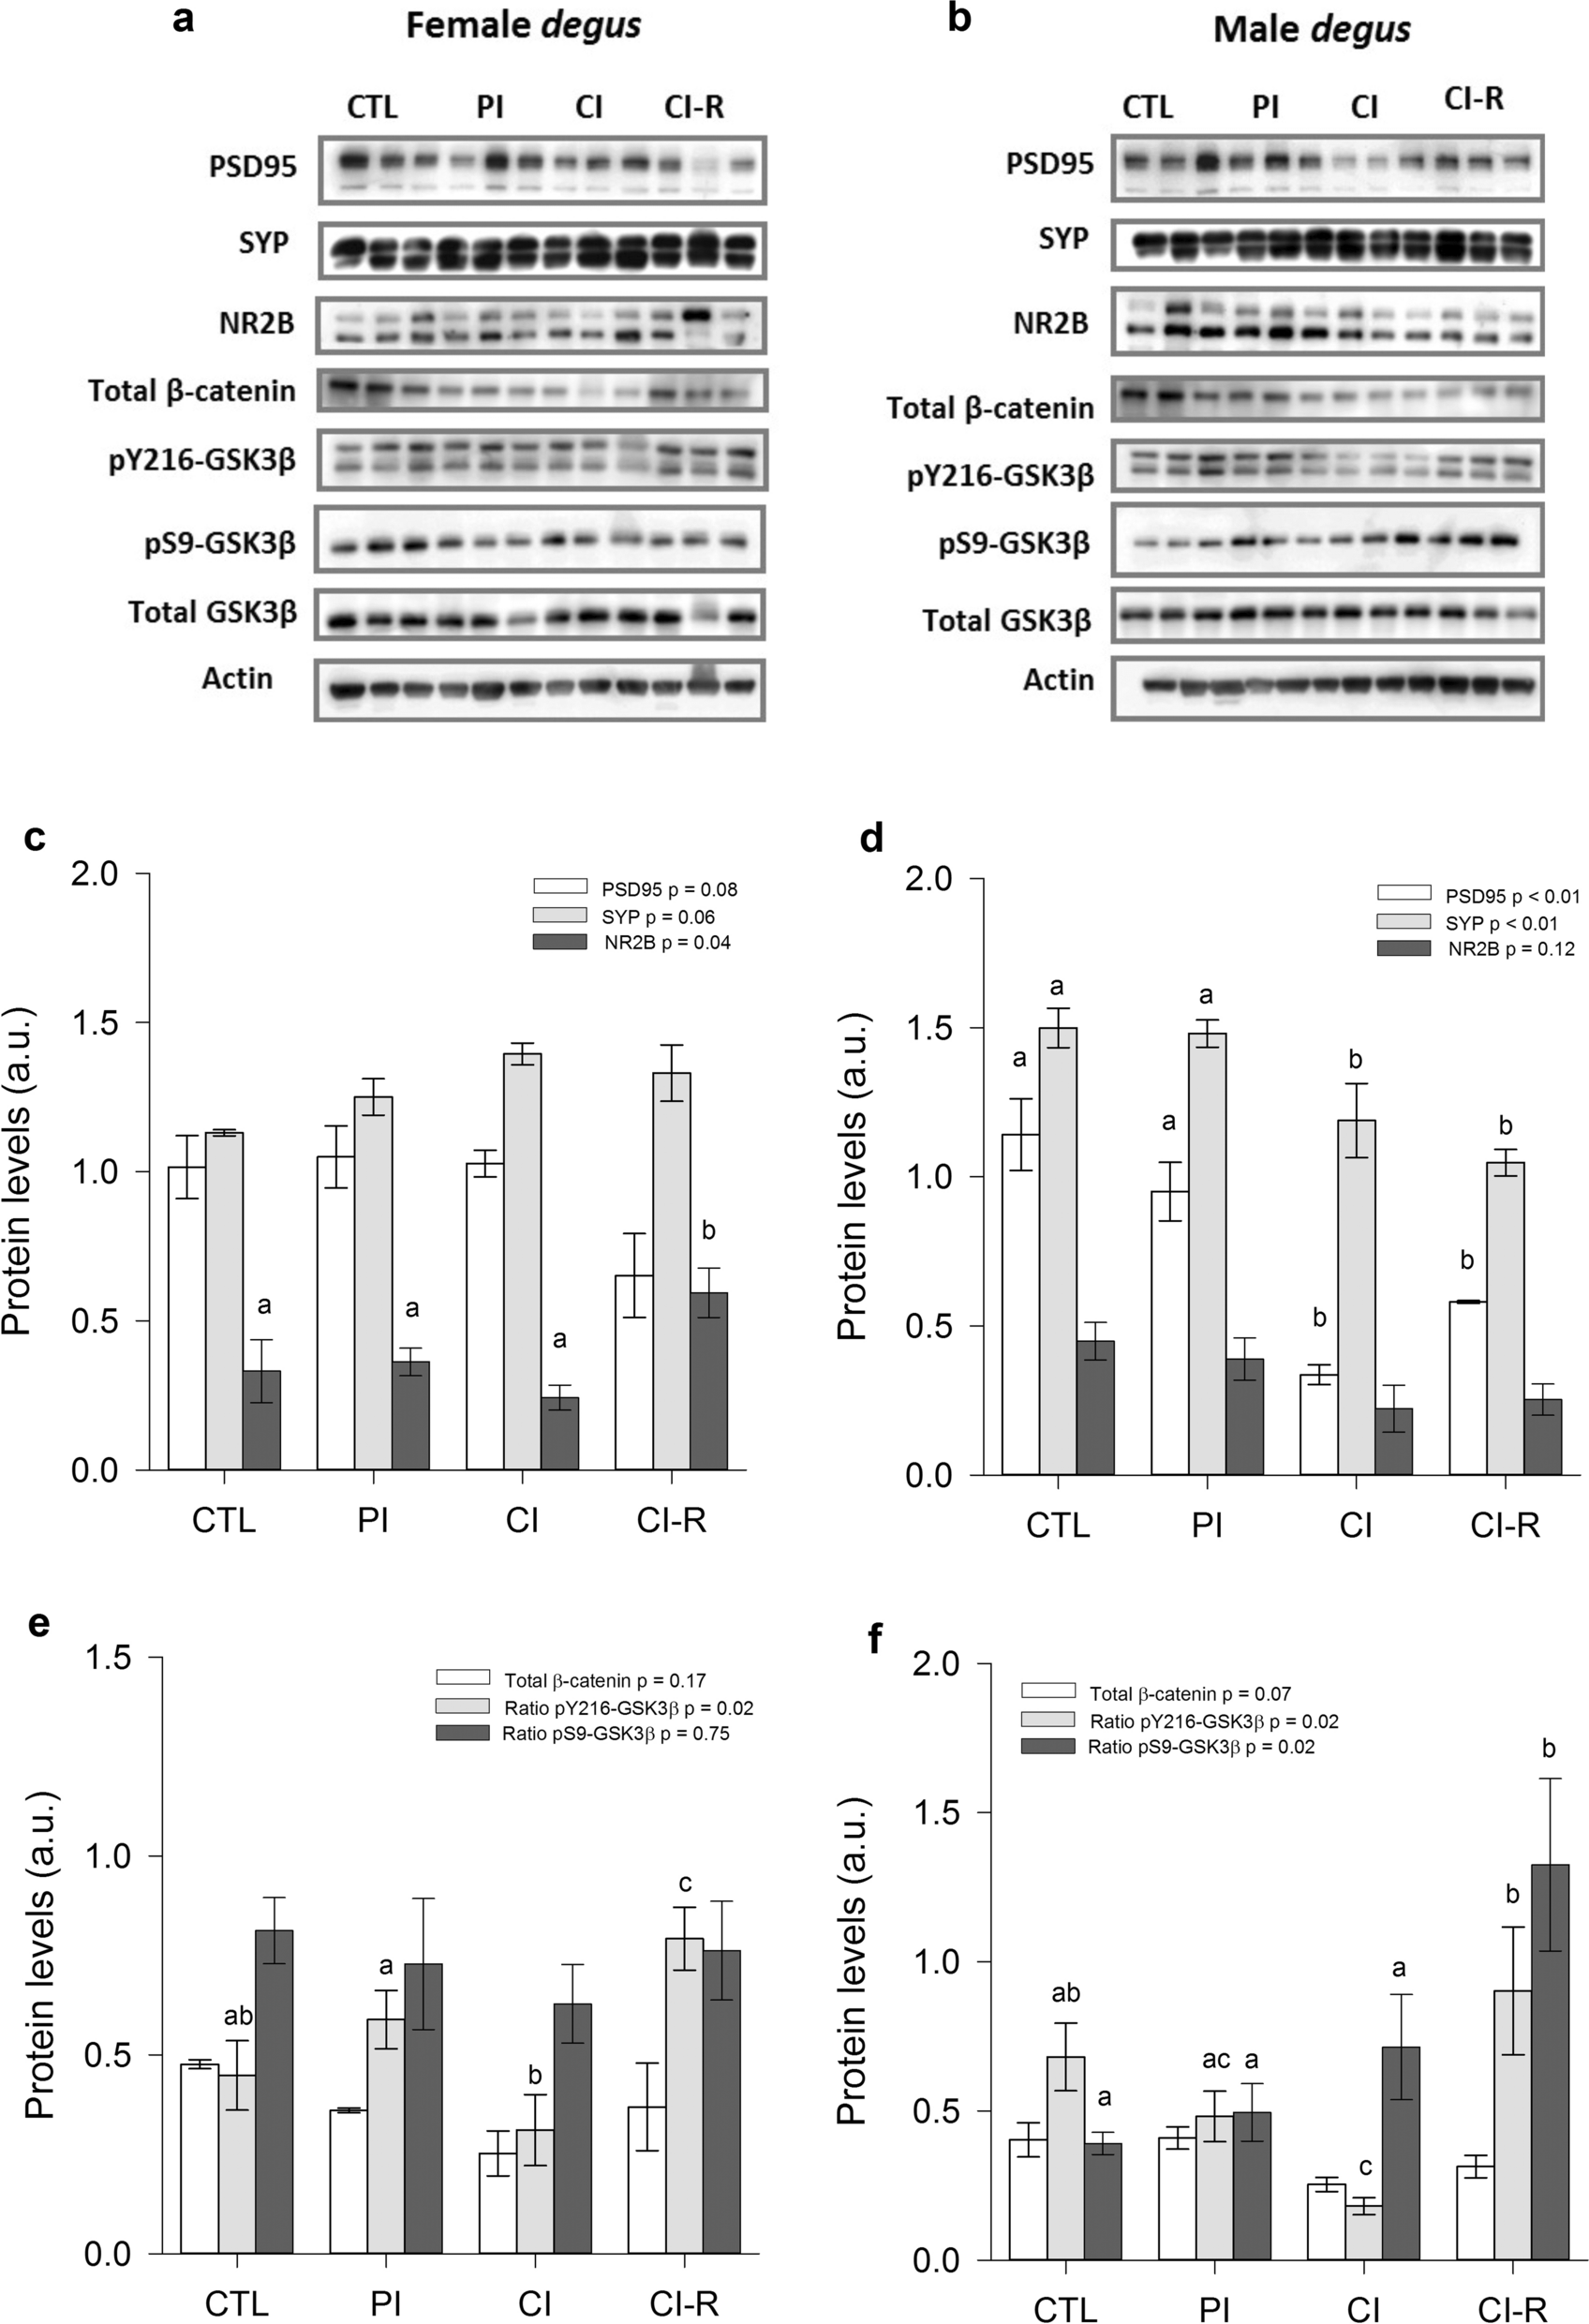
Biochemical analysis of hippocampal synaptic and canonical Wnt signalling proteins. Western blot analysis for (a) female degus (b) male degus. Densitometric analysis of hippocampal PSD95, SYP, and NR2B proteins of (c) female degus (d) male degus. Densitometric analysis of hippocampal total β-catenin, ratio pY216-GSK3β, and ratio pS9-GSK3β of (e) female degus (f) male degus. Data were analysed statistically using one-way ANOVAs, with the p-value indicated at the top of each figure. Different letters above bars show statistical differences between the same protein across stress treatments (Fisher’s LSD post hoc test). Results are expressed as mean ± SE (n = 3). a.u: arbitrary units. Control (CTL), Partial Isolation (PI), Chronic Isolation (CI), and Re-socialization (CI-R) treatment groups.
