
Figure 1
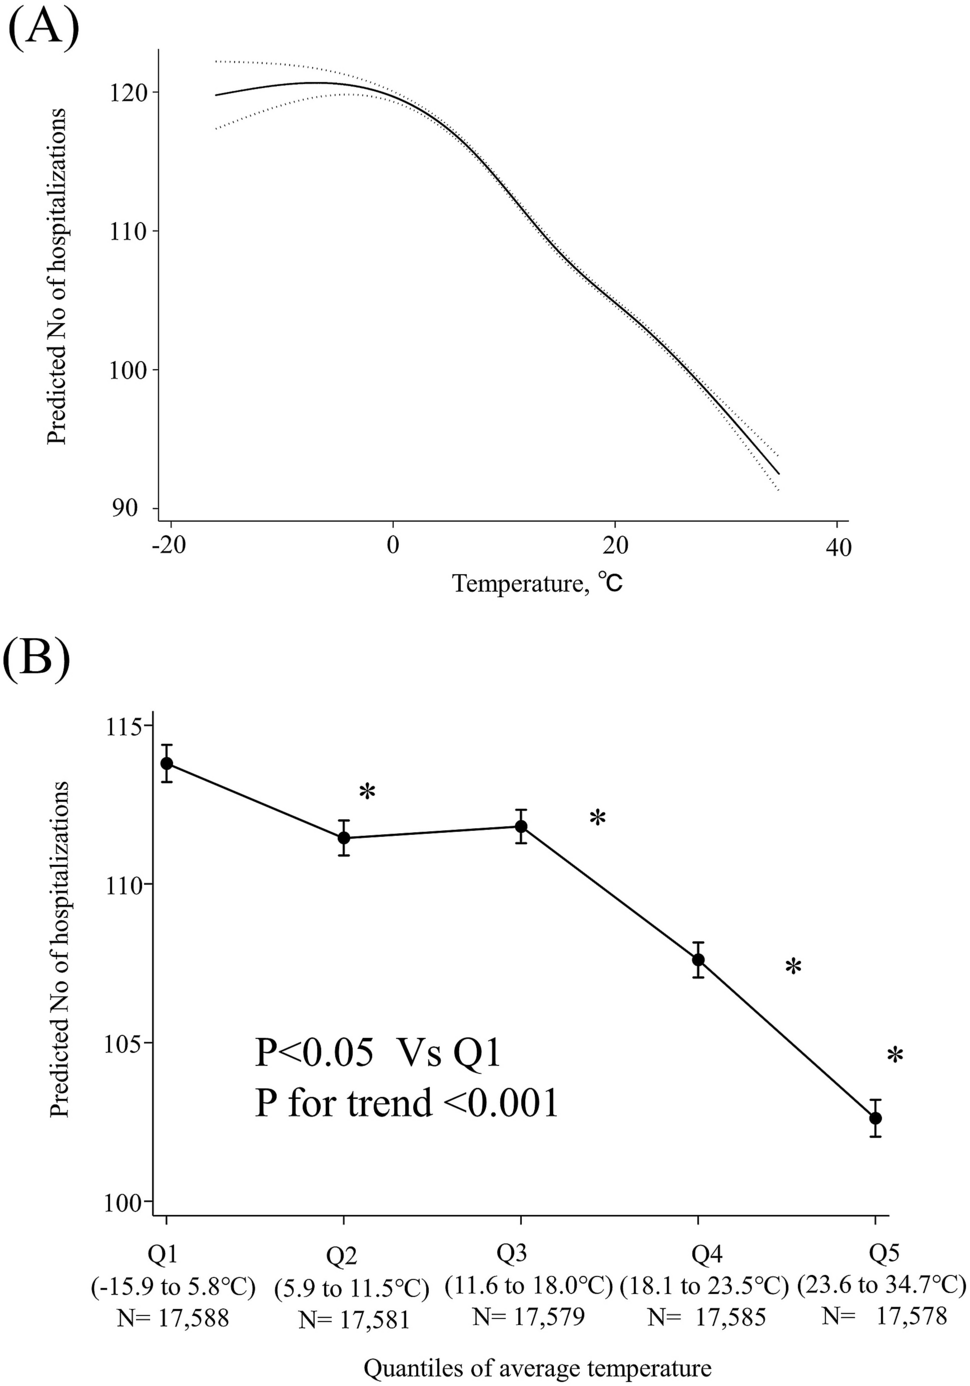
Association between average weather temperature and acute myocardial infarction hospitalizations. (A) MVRS (multivariable regression splines) indicated a linear relationship with temeprature. The predicted number of AMI per day was univariate. The x-axis represents temperature (°C) as a continuous variable. The solid and dashed lines indicate 95% confidence intervals. (B) The adjusted predicted number of AMI per day was calculated using “marginsplot” after the creation of multilevel mixed random-effects and population-averaged linear models in STATA. The covariates are the same as in Table 2. The x-axis represents temperature (°C) as a categorical variable according to the weather temperature quantiles. Bars indicate 95% confidence intervals. Q, quantile. The association of hospitalization with temperature was close to linear.
