
Figure 2
From: Traffic signal optimization on a square lattice with quantum annealing
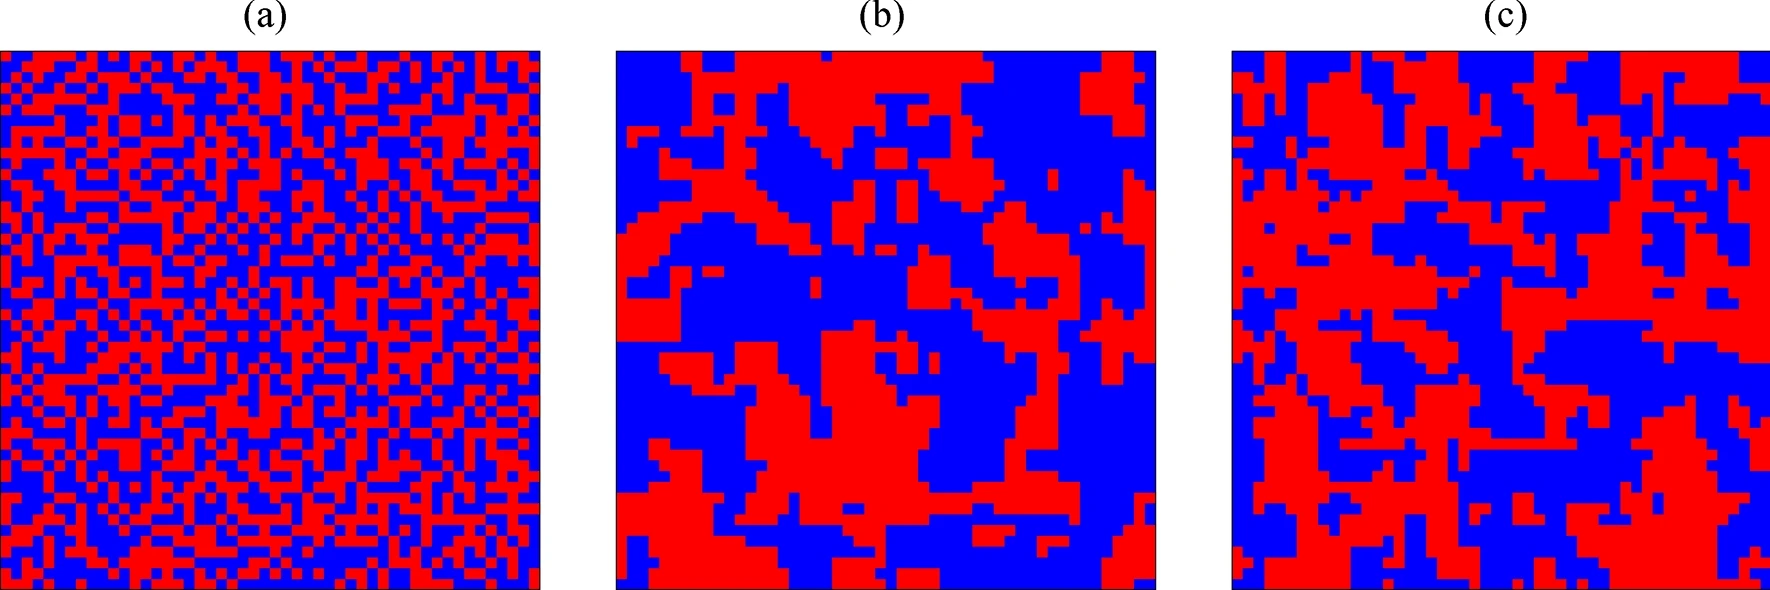
Snapshots of traffic signals under different control methods. (a) Local controller using Eq. (11), (b) Global controller optimizing Eq. (10) with the simulated annealing, and (c) Global controller optimizing Eq. (10) with the D-Wave 2000Q. Red and blue dots represent vertical and horizontal directions allowed at each crossing, respectively. Parameters \(\alpha , \eta\), and L are fixed as \(\alpha =0.8, \eta =1.0\), and \(L=50\), respectively. For the D-Wave method, the Hamiltonian is divided into 42 groups and the optimization problem is solved in parallel. See “Methods” for details. (The data are plotted with software Python/matplotlib).
