
Figure 1
From: New thermodynamic activity-based approach allows predicting the feasibility of glycolysis
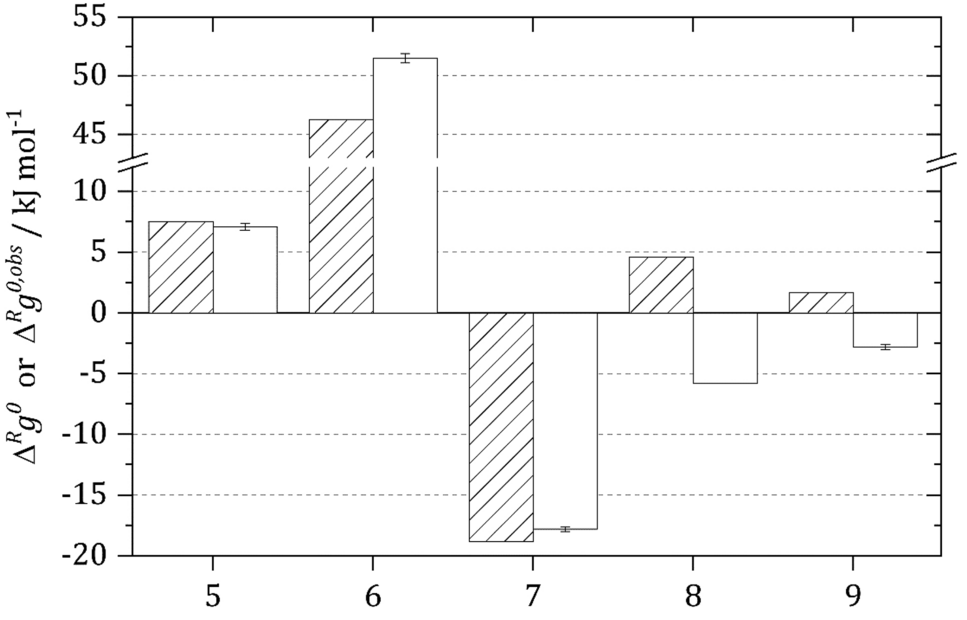
Comparison between the concentration-based standard Gibbs energy of reaction \({\Delta }^{R} g^{0,obs}\) (striped bars)29 and the activity-based standard Gibbs energy of reaction \({\Delta }^{R} g^{0}\) (white bars) of the glycolytic TPI reaction (5), GAPDH reaction (6), PGK reaction (7), PGAM reaction (8) and enolase reaction (9) at 298.15 K and pH 7.0 based on12, 15, 22,23,24. Please note that H+ was not considered for GAPDH reaction in the original source, but was added by us as this is a reaction participant.
