
Figure 1
From: Dye tracing and concentration mapping in coastal waters using unmanned aerial vehicles
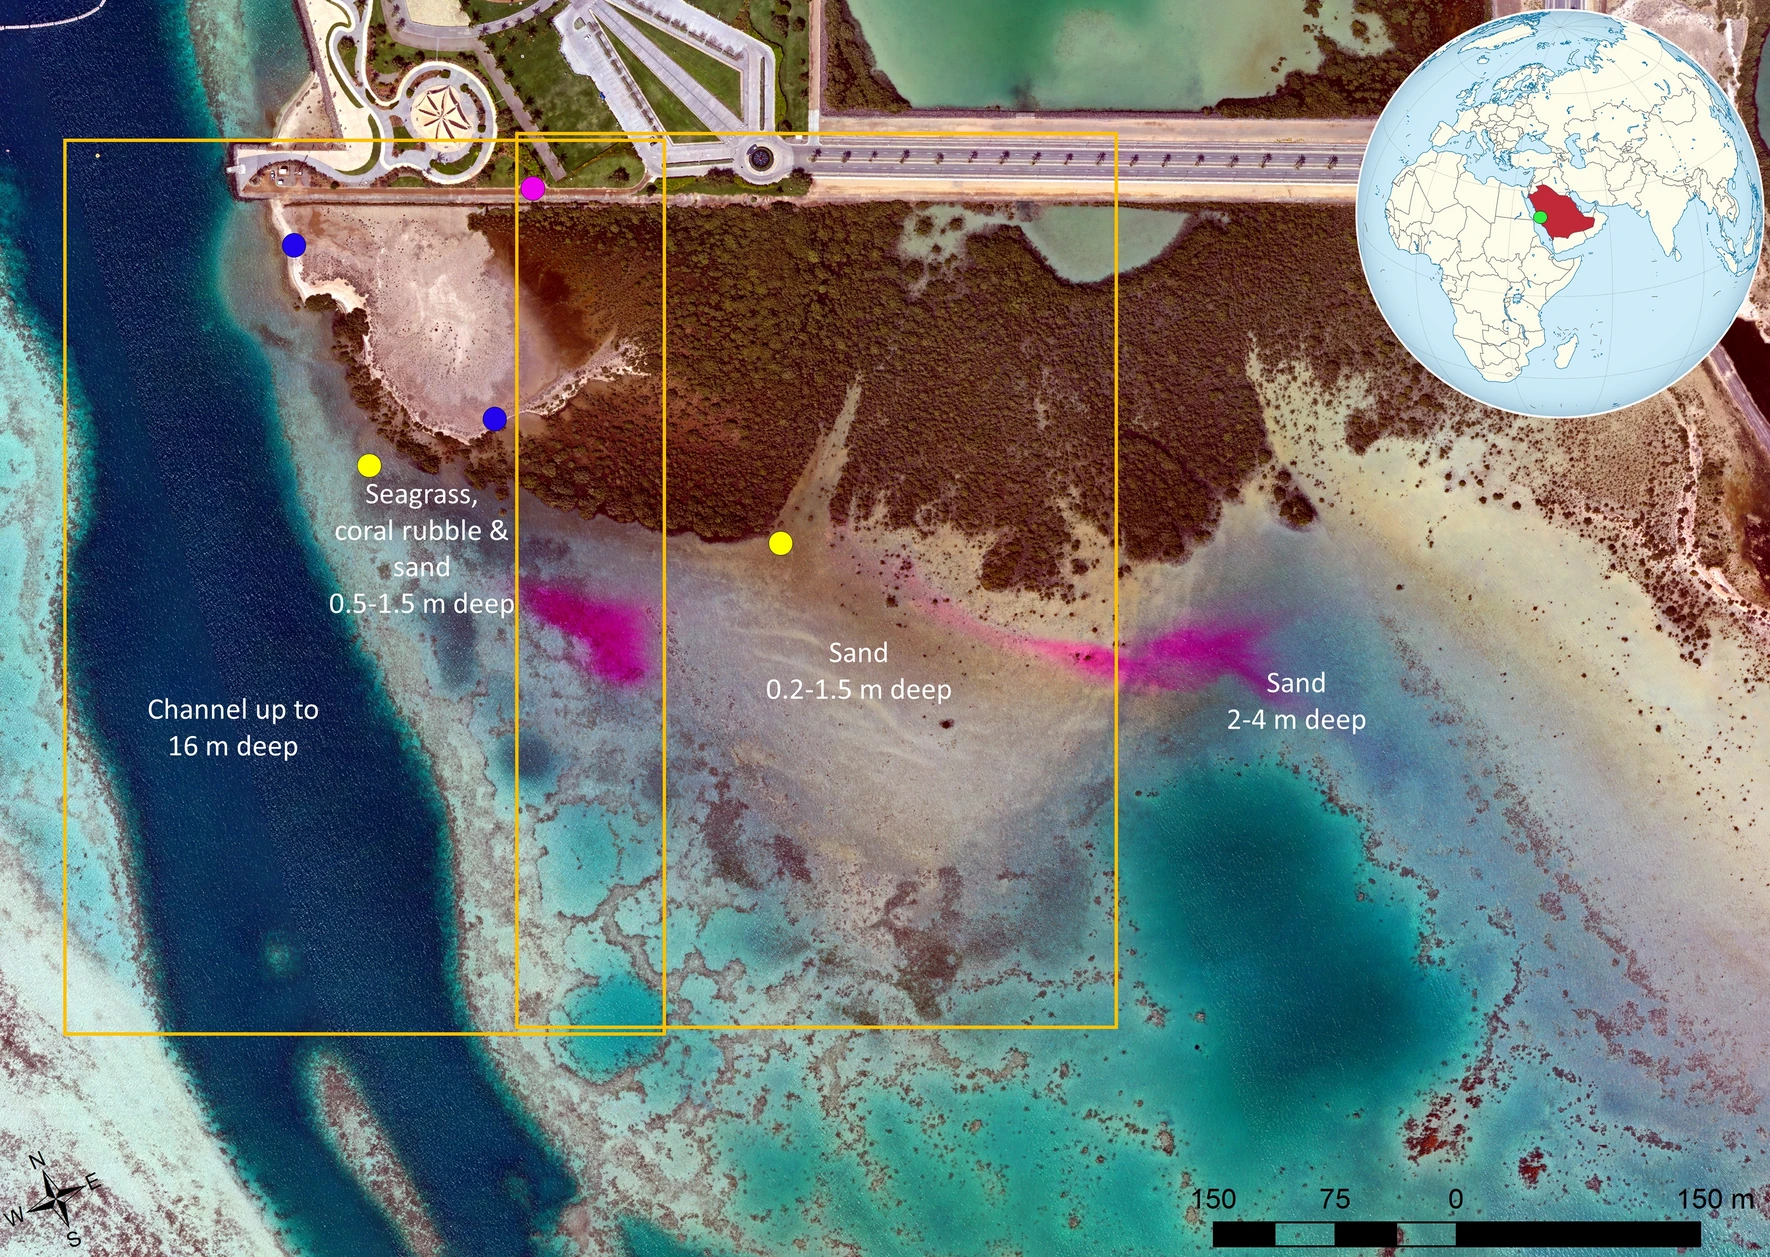
Map of the study area. Unmanned aerial vehicle (UAV) orthomosaic based on image data collected between 14:20 and 14:37 on March 18, 2021 of the study area, showing the two fluorescent dye plumes (magenta) to the south of the mangroves. The yellow dots represent the locations of dye release, the blue dots display the locations of two weather stations and the magenta dot indicates the location of the radiometric calibration targets. The orange outlines display the extent covered by the hovering UAV images. The green dot in the insert indicates the location of the study area in Saudi Arabia (highlighted in red). Software used to produce the map: Agisoft Metashape version 1.7.1 (www.agisoft.com) and ArcGIS version 10.5.1 (www.esri.com/en-us/arcgis).
