
Figure 1
From: Occupations and their impact on the spreading of COVID-19 in urban communities
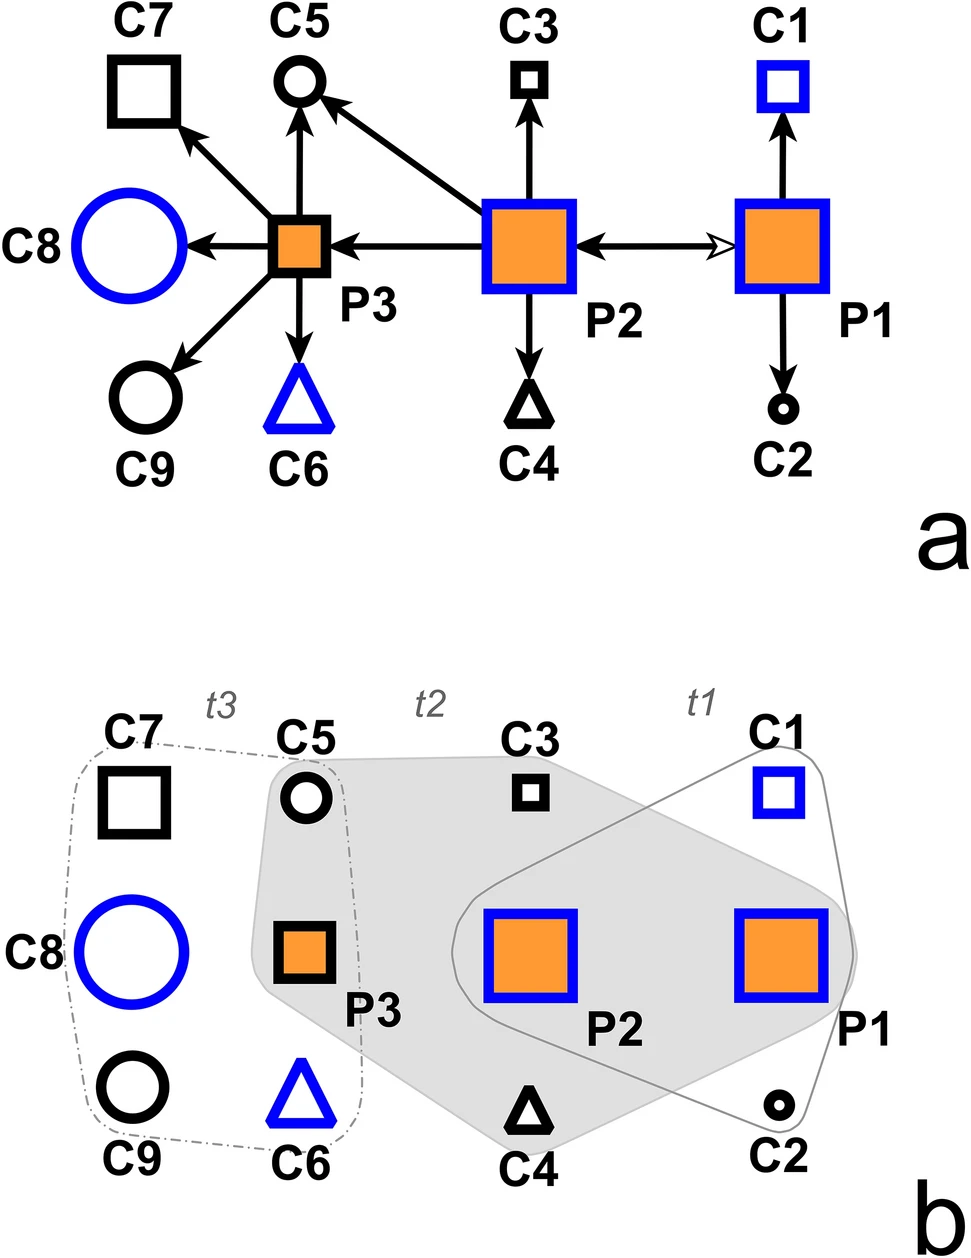
Illustration of a human-to-human COVID-19 transmission network. Positive cases (referees) are in orange, and referrals (contacts) are in white. Blue-bordered nodes mark females while black-bordered mark males. Geometric shapes correspond to occupational classes: squares designate people in the private sector, triangles mark people in the public sector, and circles are not-active individuals (minors, pensioners, university students). Arrows mark the direction of the elicitation process: pointing from the referee (positive case) to the referral (nominated contact). Node size is proportional to age. The image displays (a) dyadic and (b) hypergraph representations of the transmission network. In Fig. 1b, the hypergraphs (contact-nomination events) are attached time-stamps to show their position in time. Overlapping areas mark nodes belonging to more than one hypergraph.
