
Figure 1
From: Tracing human influence on rising surface air temperature in Venezuela
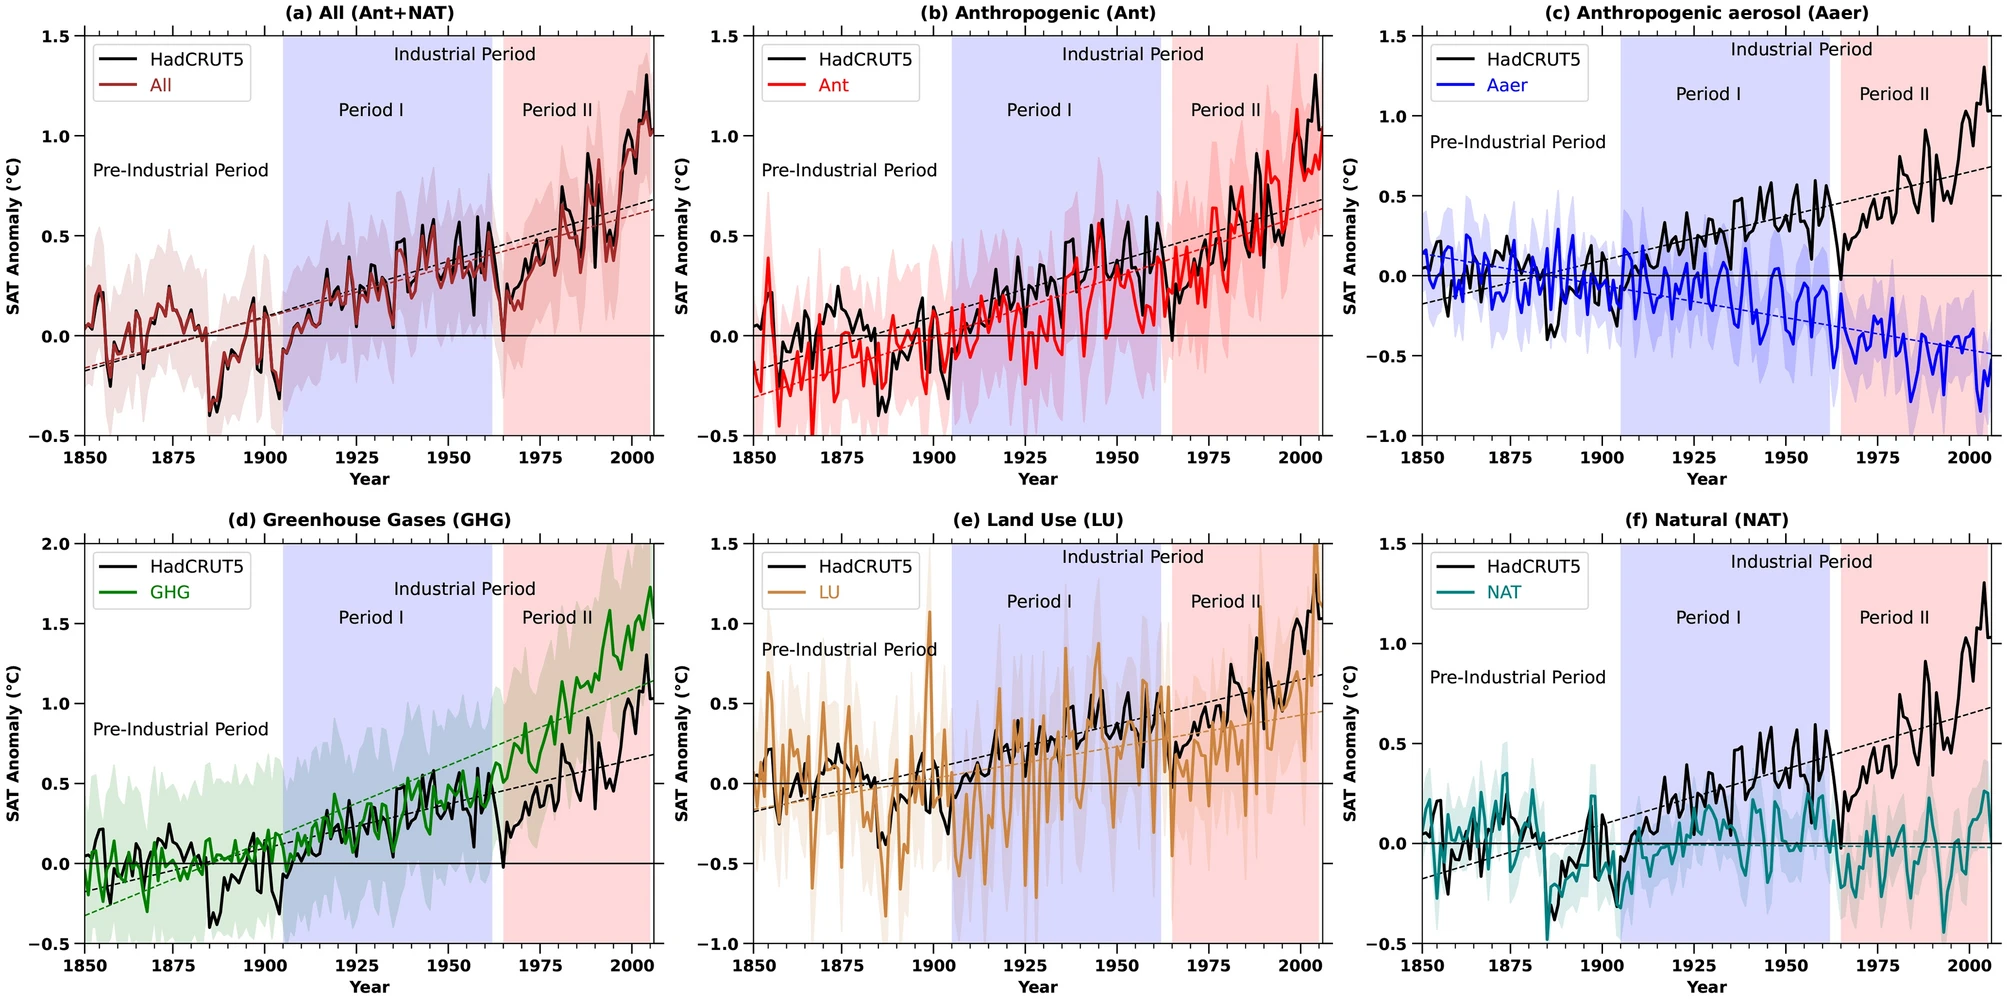
Temporal evolutions of each forcing and attribution of human influence over Venezuela. The graph illustrates the temporal variation of annual surface air temperature anomalies from 1850 to 2005. The category “All” encompasses historical forcings, representing all types of influences. Specific forcings such as anthropogenic (Ant = All-NAT), Aaer, GHG, LU, Natural forcings (NAT) (this includes solar radiation and volcanic eruptions), and Anthropogenic forcings (Ant) are individually depicted. Additionally, observed HadCRUT5 temperature data for the period 1850–2005 is included for each forcing. Robust regression analysis was conducted at a 95% confidence level to analyze trends, and the results are superimposed in each panel. Only the regression lines that have a 95% confidence level are presented.
