
Fig. 7
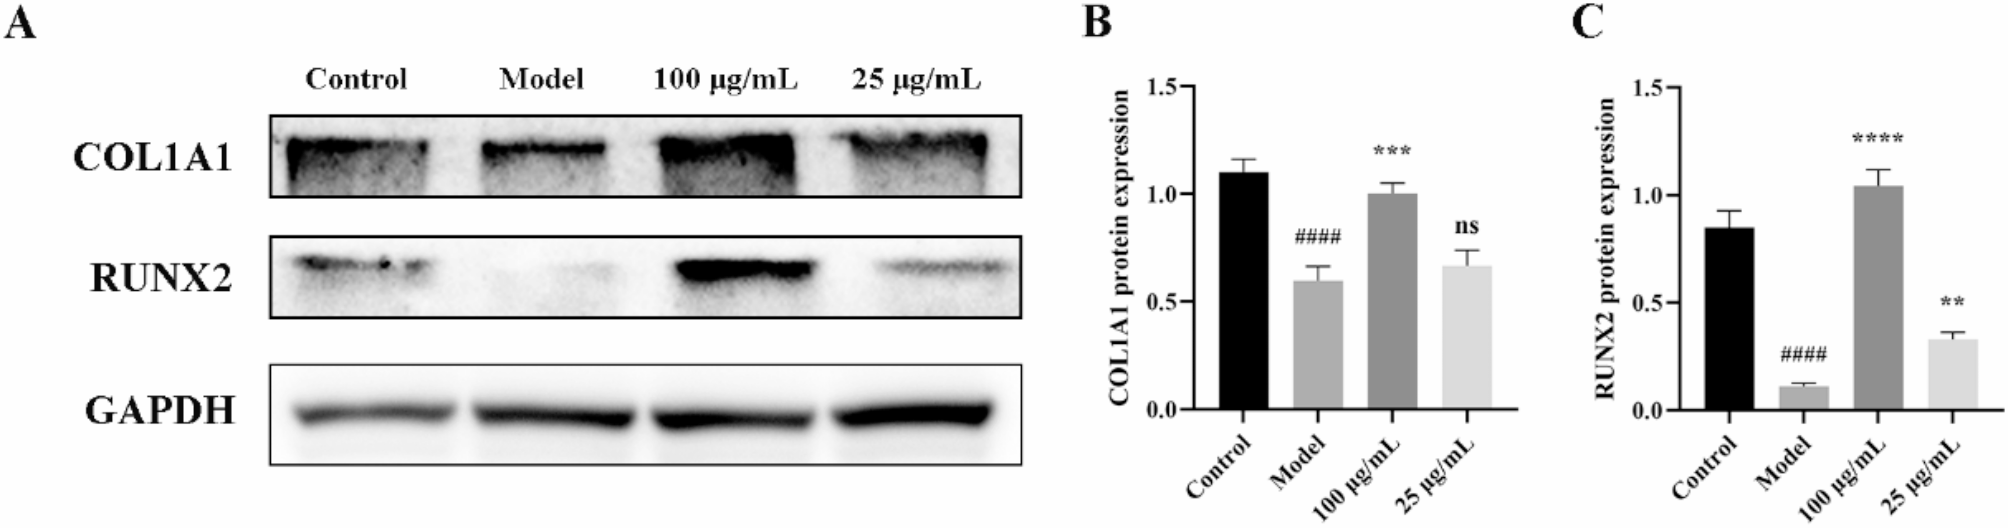
(A) Western blot analysis of COL1A1 and RUNX2 proteins expressions. (B) Quantification of COL1A1 protein expression level. (C) Quantification of RUNX2 protein expression level. Data are presented as mean ± SD. ####P < 0.0001 versus the control group. **P < 0.01, ***P < 0.001, and ****P < 0.0001 versus the model group.
