
Fig. 2: Changes in lifestyle alterations from baseline to 12-month follow-up.
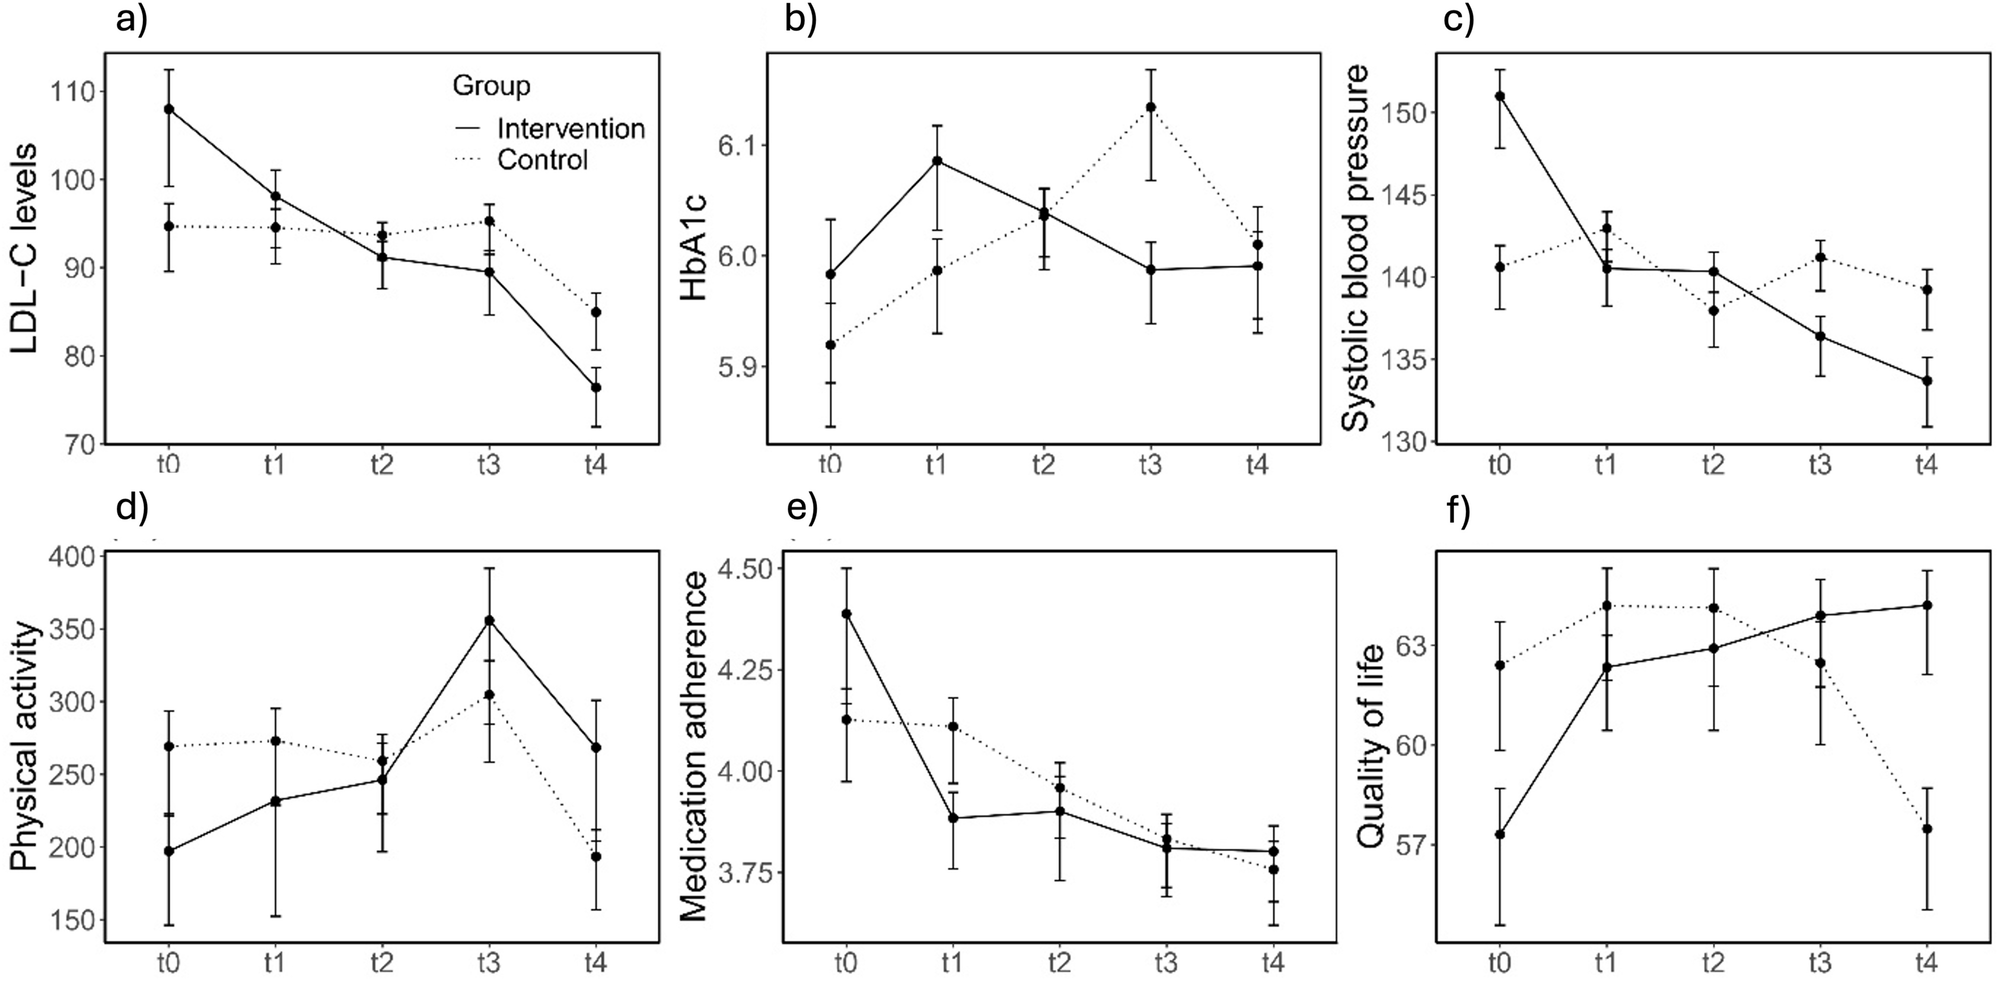
Changes in lifestyle alterations from baseline (t0) to 12-month follow-up (t4) in intervention (n = 121) and control groups (n = 119). a LDL-C levels (mg/dl): The intervention group experienced a progressive and significant reduction in LDL-C levels over time compared to the control group, with marked improvements evident by t4. b HbA1c levels (%): Glycemic control, as indicated by HbA1c, fluctuated over time, with the intervention group showing improved stability after an initial rise after 3 months (t1), whereas the control group displayed more variable trends. c Systolic blood pressure (mmHg): A consistent decrease in systolic blood pressure was observed in the intervention group, achieving significant reductions by t4, while the control group showed no substantial change. d Physical activity (minutes per week): The intervention group exhibited a notable increase in physical activity after 6 months (t2), followed by a decline but maintained higher levels than baseline. The control group showed minimal variability. e Medication adherence (lower scores indicate higher adherence): Both groups showed a gradual decline in medication adherence over time, though the intervention group demonstrated slightly better maintenance of adherence, particularly at earlier time points. f Quality of life: The intervention group experienced a gradual improvement in quality-of-life scores, surpassing the control group by t4. Variability was observed within both groups at intermediate time points. This figure illustrates the longitudinal effects of the intervention on cardiovascular risk factors and lifestyle-related outcomes, demonstrating greater improvements in the intervention group across most domains. Statistical significance (p-values) and effect sizes were not shown but are described in the text. Error bars represent 95% confidence intervals for adjusted within-subject standard errors. t0: baseline examination, t1: 3 months follow-up, t2: 6 months follow-up, t3: 9 months follow-up, t4: 12 months follow-up.
