
Fig. 1: High light and high temperature resulted in a comparable reduction in net CO2 assimilation rates and high light also caused significant photoinhibition in S. viridis leaves.
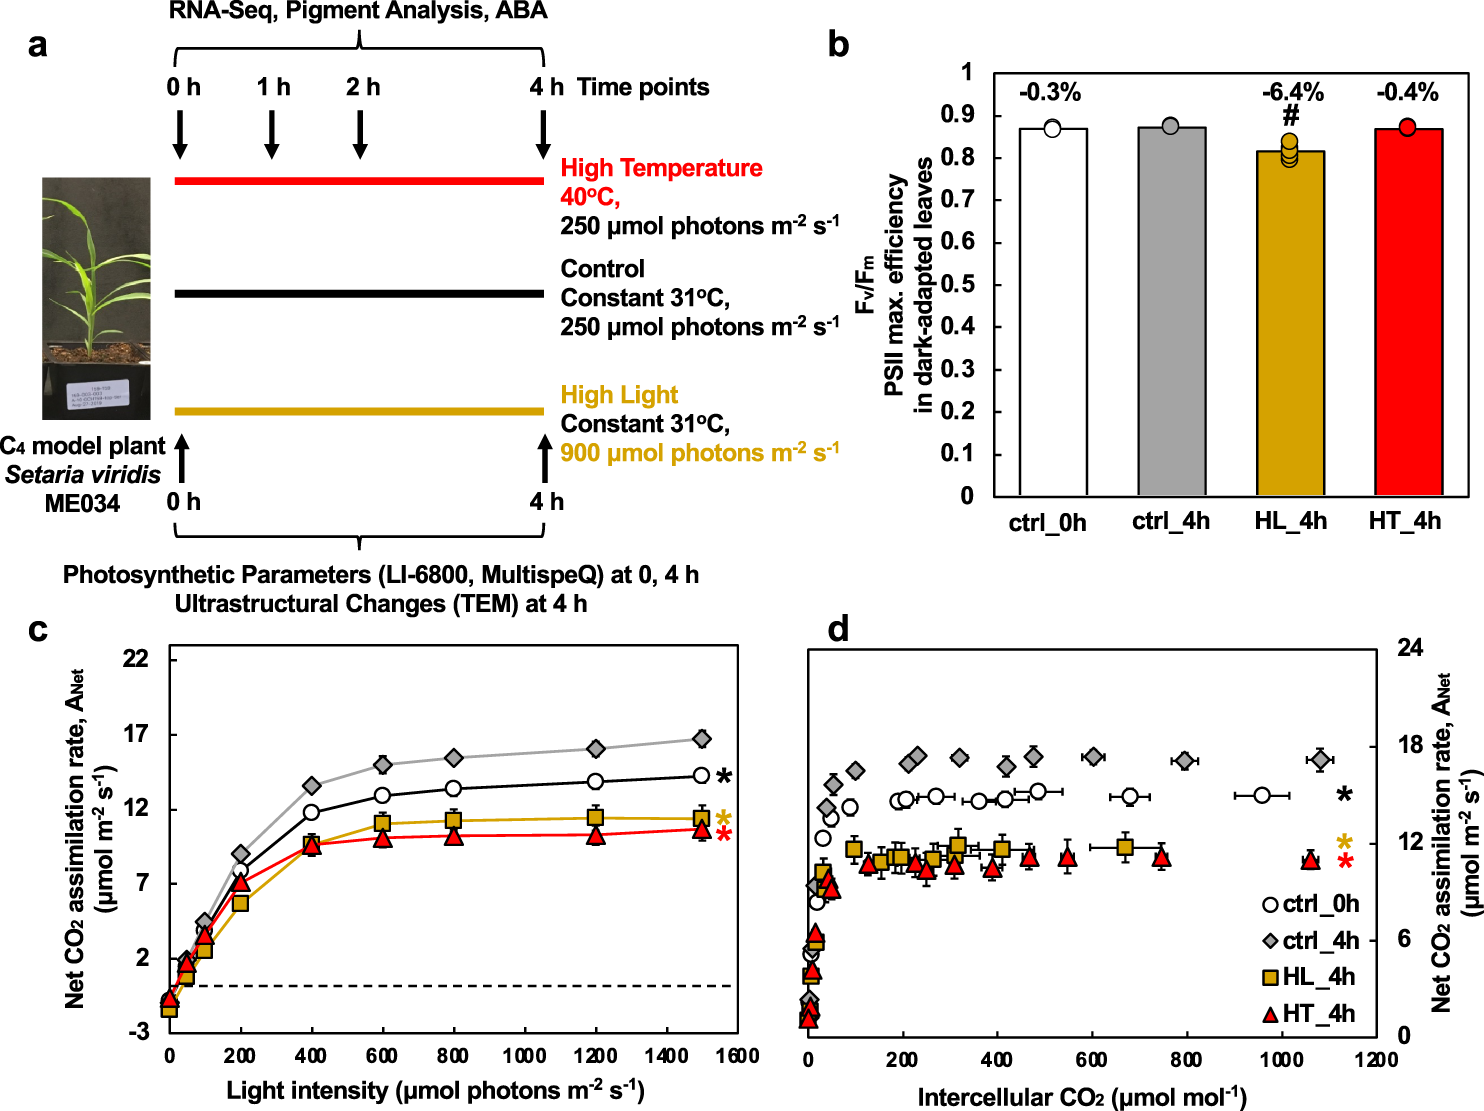
a Experimental overview. We investigated how the C4 model plant S. viridis ME034 responded to high light or high temperature at different levels. Plants grown under the control condition were treated with control condition or high light or high temperature for 4 h. Leaf tissues from different treatments were harvested at different time points for the analysis of RNA-seq, pigments, and leaf ABA levels. Photosynthetic parameters were measured at 0 and 4 h time points, including gas exchange and chlorophyll fluorescence using LI-6800 and spectroscopic measurements using MultispeQ. Transmission electron microscopy (TEM) analysis was performed to investigate chloroplast ultrastructure changes in leaves after 4 h treatments. b High-light-treated leaves had reduced PSII maximum efficiency (Fv/Fm) measured by chlorophyll fluorescence with 20 min dark-adapted leaves. Pound symbols indicate statistically significant differences of ctrl_0h (at the start of treatments), HL_4h (after 4 h HL), and HT_4h (after 4 h HT) compared to ctrl_4h (after 4 h control treatment) using Student’s two-tailed t-test with unequal variance (#p < 0.01). Percentages indicate reduction in Fv/Fm compared to ctrl_4h. c, d Net CO2 assimilation rates during light response and CO2 response, respectively. Most data points of ctrl_0h, HL_4h, and HT_4h were statistically significantly different compared to ctrl_4h using Student’s two-tailed t-test with unequal variance, denoted by asterisks at the end of curves. p-Values were corrected for multiple comparisons using FDR (*p < 0.05, the colors of * match the significance of the indicated conditions, black for ctrl_0h, yellow for HL_4h, red for HT_4h). Mean ± SE, n = 3–6 biological replicates.
