
Fig. 1: Suppressive effects of SFN on SeP at the protein and mRNA levels in HepG2 cells.
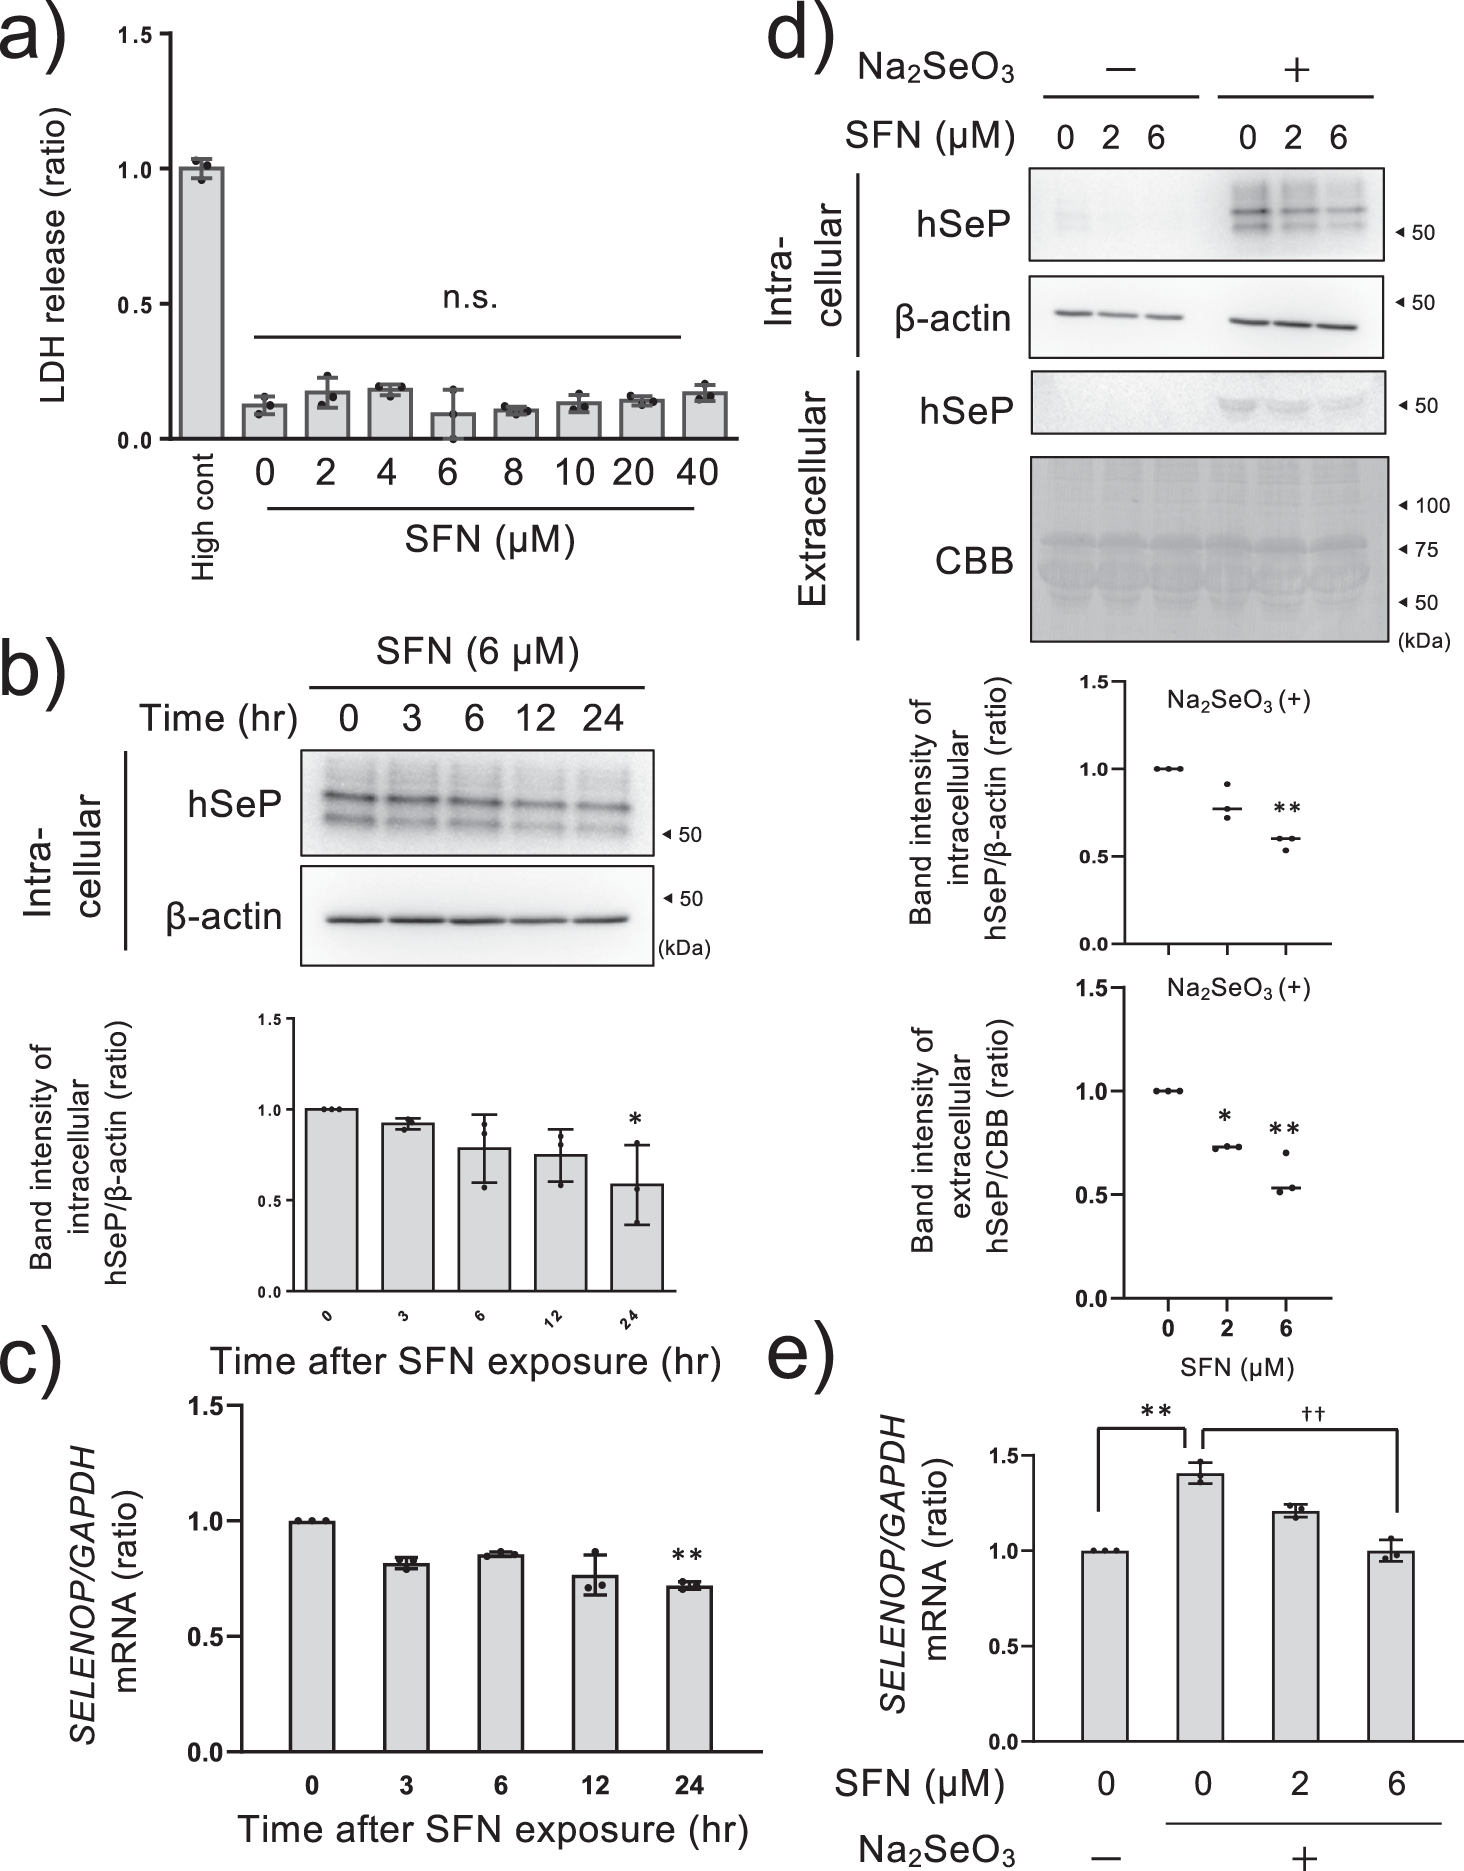
HepG2 cells were cultured in high glucose DMEM containing selenite (100 nM) for 24 h and treated with SFN at the indicated concentration for 24 h. The cytotoxicity was measured by LDH assay (a). The data is expressed as Mean ± S.D. (n = 3), and is shown as a relative value with the lysed control (High cont) as 1. HepG2 cells were cultured in high glucose DMEM containing selenite (100 nM) for 24 h and treated with 6 µM SFN for the indicated time. Then cell lysate was collected and SeP was detected by western blotting (upper panel) and quantified (lower panel. n = 3) (b). The total RNA was collected and SELENOP mRNA was detected by RT-qPCR (c). The data is expressed as Mean ± S.D (n = 3). The cells were treated with SFN at the indicated concentration for 24 h. Then the culture medium and cell lysate were collected and SeP was detected by western blotting (upper panel) and quantified (lower panel, n = 3) (d). Total RNA was collected and SELENOP mRNA was detected by RT-qPCR (e). Intracellular and extracellular SeP were corrected with β-actin or CBB-stained total proteins respectively. Quantitative data is shown as a relative value with the control as 1. *P < 0.05 and **P < 0.01 vs. control. One-way ANOVA, post hoc test Dunnett method were used for statistical analysis. All blots were performed on independent membranes and were done with the same sample volume applied. CBB staining was performed on the same membrane.
