
Fig. 4: Effect of SFN on serum SeP levels of normal and diabetic mice.
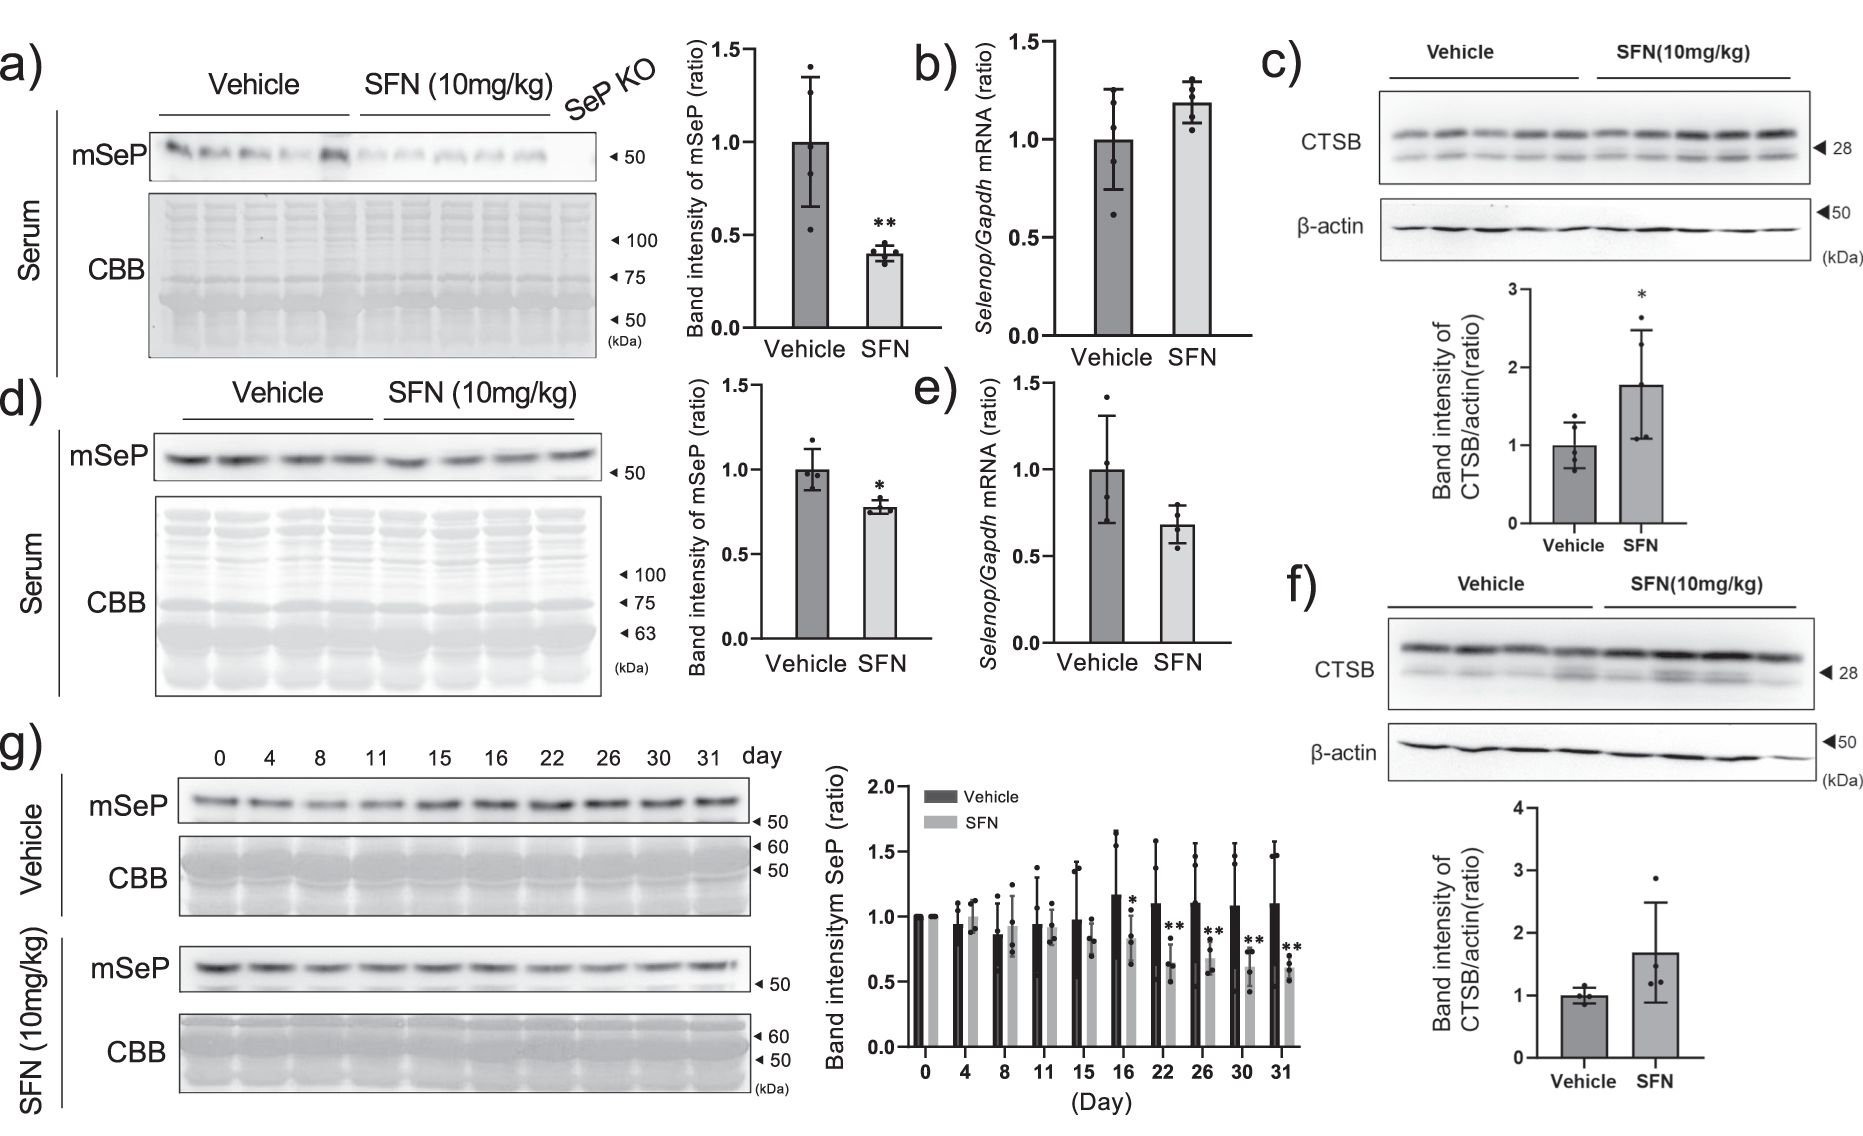
C57BL6/J mice were administered 10 mg/kg SFN every 12 h for 48 h. Serum was taken from 5 mice administered either vehicle or SFN, and the amount of SeP was measured by western blotting and quantified (a). The serum of a SeP KO mouse was loaded as the negative control (SeP KO). Hepatic Selenop mRNA was measured by RT-qPCR (b), and mature-cathepsin B (CTSB) protein levels were measured by western blotting (c). The SeP band intensity was corrected and quantified by CBB-stained total proteins. The data is expressed as mean ± S.D. (n = 5), and shown as a relative value with the control as 1. The student’s t-test was used for statistical analysis. KKAy mice were administered 10 mg/kg SFN or vehicle every day for 1 month. Serum was taken from 5 mice per group, and the amount of SeP protein was measured by western blotting (d) and its quantification is shown (right panel). The student’s t-test was used for statistical analysis. Hepatic Selenop mRNA (e) and CTSB protein levels were measured (f). The change in serum SeP level due to treatment with SFN was measured by western blotting (g). The quantified data is expressed as mean ± S.D. (n = 4), and shown as a relative value with the control as 1. *P < 0.05 and **P < 0.01 vs. control. All blots were performed on independent membranes and were done with the same sample volume applied. CBB staining was performed on the same membrane.
