
Table 1 Thermodynamic and kinetic parameters of folding of thioredoxin variants 25 °C and pH 7.0.
From: Acceleration of protein folding by four orders of magnitude through a single amino acid substitution
Thermodynamic parameters of GdmCl-dependent unfolding/refolding equilibria of the thioredoxin variants, and folding rates Trx WTox and Trx1Pox involving the trans-to-cis isomerization of Pro76* | ||||||
|---|---|---|---|---|---|---|
Trx variant | meq (kJ mol−1 M−1) | D1/2 (M GdmCl) | ΔD1/2a (M GdmCl) | ΔΔG0ox/red at the mean D1/2b (kJ mol−1) | kItrans→Ncis (s−1)c | |
Trx WTox | 15.9 ± 0.34 | 2.24 | 0.74 | 12.0 ± 0.3 | 3.11 ± 0.20 · 10−3 | |
Trx WTred | 16.5 ± 0.50 | 1.50 | n.d.g | |||
Trx0Pox | 9.53 ± 0.43 | 1.97 | −0.79 | −7.6 ± 0.4 | n.a.h | |
Trx0Pred | 9.82 ± 0.64 | 2.76 | n.a.h | |||
Trx1Pox | 13.3 ± 0.29 | 2.85 | 0.06 | 0.8 ± 0.1 | 1.16 ± 0.15 · 10−4 | |
Trx1Pred | 11.8 ± 0.32 | 2.79 | n.d.g | |||
Kinetic parameters of unfolding and refolding that are independent of proline cis/trans isomerization ** | ||||||
Trx variant | (s−1) | (s−1) | mFd(M−1) | m U d (M) −1 | ΔG0kin(kJ mol−1) | mkin(kJ mol−1M−1) |
Trx0Pox | 7.70 ± 0.76 | 7.00 ± 1.3 ∙ 10−3 | −1.69 ± 0.10 | 2.17 ± 0.06 | −17.4 ± 2.0 | 9.56 ± 0.40e |
Trx1Pox | n.d.g | 9.56 ± 0.12 ∙ 10−7 | n.d.g | 3.55 ± 0.05 | n.d.g | n.d.g |
Trx1Pox Itrans | 7.52 ± 0.77f | 1.14 ± 0.62 ∙ 10−4f | n.a.h | n.a.h | −27.5 ± 2.4f | 12.7 ± 1.89f |
- aDifference between the transition midpoints of both redox forms, defined as D1/2 (ox)−D1/2 (red).
- bTo avoid errors due to extrapolation to zero denaturant, the differences between the free energies of folding of the oxidized and reduced forms was calculated at the GdmCl concentrations corresponding to the mean value of the respective transition midpoints (D1/2 mean). D1/2 mean values were 1.87, 2.37 and 2.82 M GdmCl for Trx WT, Trx0P and Trx1P, respectively. The ΔΔG0ox/red values are defined such that positive values mean that the oxidized form is more stable than the reduced form.
- cRate constant of the rate-limiting step in the folding of the majority of molecules (94% in the case of Trx WTox and 95% in the case of Trx1Pox) involving the trans-to-cis isomerization of the Ile75-Pro76 peptide bond, determined in the presence of 0.2 M GdmCl by interrupted refolding experiments (cf. Fig. 4a and Supplementary Fig. 3).
Figure 4 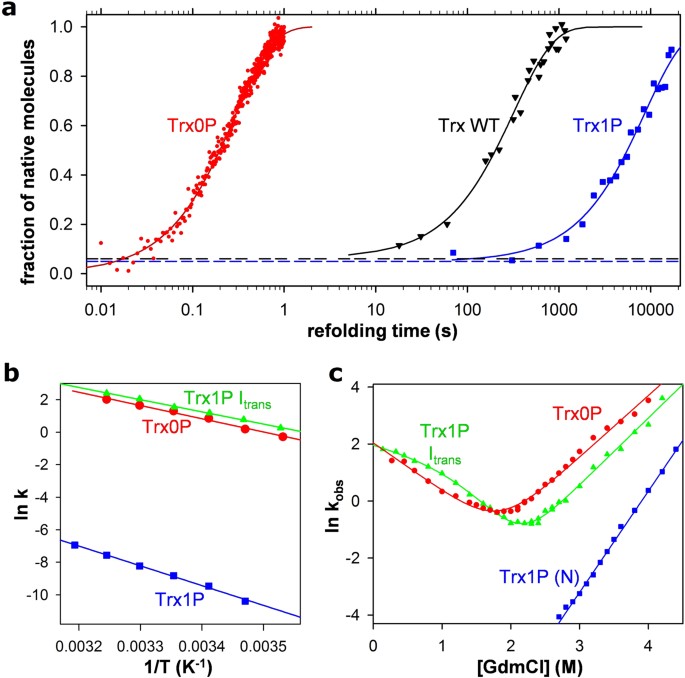
Folding kinetics of the oxidized forms of Trx WT, Trx0P, Trx1P and its trans-Pro76 intermediate (Itrans) at 25 °C and pH 7.0.
a: Kinetics of formation of N during refolding by dilution from 4.0 to 0.2 M GdmCl. Folding of Trx0Pox (red dots) was consistent with a two-state mechanism (cf. panel C). A monoexponential fit (solid line) yielded an apparent rate constant of folding of 3.49 ± 0.01 s−1. Formation of N during refolding of Trx WT and Trx1P was recorded with interrupted refolding experiments (cf. Fig. S3). Trx WT (black triangles) showed 6% fast folding molecules (black dotted line), and 94% of the molecules reached N at a single rate of 3.10 ± 0.18 · 10−3 s−1 (solid line). Trx1P (blue squares) showed 5% fast folders (blue dotted line), and the residual 95% folded very slowly with a single rate of 1.16 ± 0.15 · 10−4 s−1. The indicated errors are standard errors from monoexponential fits. b: Arrhenius plot for folding of Trx0P (red circles), formation of Itrans from unfolded Trx1P (green triangles), and formation of native Trx1P from Itrans (blue squares), yielding activation energies of 67.6 ± 3.2, 62.4 ± 1.4 and 101.0 ± 2.8 kJ mol−1, respectively. The indicated errors are standard errors from Arrhenius fits. c: Chevron Plots showing the dependence of the apparent rate constant of unfolding/refolding (kobs) on [GdmCl] for Trx0P (red circles) and Trx1P Itrans (green triangles). Data were fitted according to a two-state model of protein folding in the case of Trx0P (solid, red line). Unfolding/refolding of Itrans was evaluated according to a three-state model55 with a high-energy on-pathway intermediate (solid, green line) (see legend to Table 1 for the deduced kinetic parameters). The unfolding branch of Trx1P is shown for comparison.
- dKinetic m values, corresponding to the linear dependence of ln kF and ln kU on GdmCl concentration.
- eEquilibrium m value predicted from kinetic data with the equation mkin = (mU–mF)·RT.
- fThe GdmCl dependence of the observed rate of folding/unfolding of Itrans (Fig. 4c) was evaluated according to a mechanism with a high-energy on-pathway intermediate (U↔I↔N) with kF = kUI and kU = kNI(kIU/kIN)33): mkin = (Σ|mi|) · RT, with mUI = −0.58 M−1, mIN = −2.22 M−1, mNI = 2.33 M−1 (mIU was fixed to zero); kUI = 7.52 s−1, kIN = 1.44 · 105 s−1, and kNI = 1.64 · 10−3 s−1 (kIU was fixed to 104 s−1). The deduced transition midpoint of Itrans is 2.17 M GdmCl.
- gnot determined.
- hnot applicable.
- *Indicated errors correspond to errors from the fits described in the legends of Figs 3a and 4a.
- **Indicated errors correspond to errors from the fits decribed in the legends to Fig. 4a,c.

