
Abstract
Objectives
Altered appetite-related gut hormone concentrations may reflect a physiological adaptation facilitating weight regain after weight loss. This review investigates hormonal changes after weight loss achieved through calorie restriction (CR), exercise (EX), or both combined (CREX).
Methods
A systematic search of PubMed (MEDLINE), EMBASE, SPORTDiscus, Cochrane Library, Web of Science, and ClinicalTrials.gov was conducted to identify randomised controlled trials (RCTs) and non-RCTs reporting in a fasting state either pre- and post-intervention appetite-related hormone concentrations or the changes therein after weight loss. The hormones examined were ghrelin, peptide tyrosine tyrosine (PYY), glucagon-like peptide -1 (GLP-1), and cholecystokinin (CCK), in their total and/or active form. Standardised mean differences (SMD) were extracted as the effect size.
Results
127 studies were identified: 19 RCTs, 108 non-RCTs, 1305 and 4725 participants, respectively. In response to weight loss induced by CR, EX or CREX, the meta-analysis revealed an increase in total ghrelin from both RCTs (SMD: 0.55, 95% CI: 0.07–1.04) and non-RCTs (SMD: 0.24, 95% CI: 0.14–0.35). A decrease in acylated ghrelin was identified for RCTs (SMD: –0.58, 95% CI: –1.09 to –0.06) but an increase was observed for non-RCTs (SMD: 0.15, 95% CI: 0.03 to 0.27). Findings also revealed a decrease in PYY (total PYY: SMD: –0.17, 95%CI: –0.28 to –0.06; PYY3-36: SMD: –0.17, 95%CI: –0.32 to –0.02) and active GLP-1 (SMD: -0.16, 95% CI: –0.28 to –0.05) from non-RCTs. Changes in hormones did not differ among the three interventions when controlling for weight loss. Meta-regression indicated that greater weight loss was associated with a greater increase in total ghrelin.
Conclusions
Weight loss induced by CR, EX, or CREX elicits an increase in total ghrelin, but varied responses in other appetite-related hormones. The extent of weight loss influences changes in appetite-related gut hormone concentrations.
Introduction
Obesity is a major public health concern with the prevalence remaining high globally, bringing healthcare challenges across countries [1, 2]. Among people who are successful at losing weight through diet alone or diet combined with exercise, individuals regain, on average, 80% of the lost weight within 5 years [3]. The reasons for weight regain after weight loss are multifactorial and include compensatory physiological mechanisms aimed at resisting weight loss and promoting weight regain [4].
Appetite related gut hormones including ghrelin, peptide tyrosine tyrosine (PYY), glucagon-like peptide 1 (GLP-1), and cholecystokinin (CCK), have strong influences on appetite and energy intake. Ghrelin, functions as an orexigenic hormone, stimulating appetite by acting on the hypothalamus [5]. In contrast, the anorexigenic hormones PYY, GLP-1, and CCK promote postprandial satiation and satiety by slowing gastric emptying and transmitting signals to the hypothalamus in proportion to caloric intake [6]. Exogenous infusion of these appetite hormones may increase/decrease subjective appetite feelings and energy intake [7,8,9,10]. In the long term, dietary induced weight loss is accompanied by reduced concentrations of total PYY and CCK and increased concentrations of acylated ghrelin and these changes have been shown to precede weight regain in people with obesity [11]. However, it is important to note that a direct association between these hormonal changes and weight regain remains inconclusive, as some studies have reported an uncoupling effect where hormone fluctuations do not consistently align with changes in appetite or food intake [12,13,14].
Calorie restriction (CR) and exercise (EX) are two primary interventions for weight management via reducing energy intake and increasing energy expenditure, respectively. One study has demonstrated that acute periods of energy restriction via diet elicit compensatory changes in appetite perceptions and appetite related hormones favouring increases in energy intake that were not observed after acute increases in energy expenditure via exercise [15]. This may be because elevated interleukin-6 (IL-6) concentrations in response to exercise stimulate PYY and GLP-1 levels [16] and suppress ghrelin expression [17], along with a redistribution of blood flow from gut hormone release sites to active muscles that may decrease acylated ghrelin due to decreased activity of the ghrelin O-acyl transferase (GOAT) enzyme, which is required to acylate ghrelin into its active form [18]. In the long-term, chronic CR has been shown to enhance perceived and physiological urges to eat [19, 20]. Conversely, habitual exercise appears to exert a dual effect on subjective appetite sensations and appetite-related hormones by increasing motivation to eat in a fasted state but enhancing postprandial satiety [21, 22]. This suggests that chronic exercise may influence appetite control differently than calorie restriction. The mechanism is unclear, but differences in appetite-related hormone changes to these interventions may be involved.
Two systematic reviews have assessed changes in circulating appetite-related hormones after dietary induced weight loss, which identified a decrease in PYY, GLP-1, and CCK, alongside an increase in ghrelin concentrations, in their total or active form [23, 24]. A meta-analysis reported no statistically significant changes in circulating total ghrelin, acylated ghrelin, and total PYY or PYY3-36 after exercise-induced weight loss in adults with overweight and obesity [25]. However, the small number of studies analysed for each hormone leaves gaps in understanding. Furthermore, no review has directly compared responses between exercise and diet induced weight loss. The current meta-analysis therefore included both randomised controlled trials (RCTs) and non-RCTs to reduce the gap in understanding and address the differences among interventions.
Additional factors may influence appetite hormone changes after weight loss. Research suggests that fat-free mass (FFM) is a major driver of energy intake compared to fat mass (FM), particularly under conditions of energy balance and negative energy balance [26]. While the exact mechanisms through which FFM modulates appetite are not fully understood, it has been proposed that myokines released during FFM loss may act at the brain level, potentially impacting circulating concentrations of appetite-related hormones [27]. Furthermore, ghrelin, which is associated with muscle growth, has been implicated in myocyte proliferation [28]. FFM loss after energy restriction may activate the preproghrelin gene, thereby stimulating ghrelin production and promoting myoblast differentiation [29]. Additionally, women tend to exhibit greater compensatory responses to CR, likely driven by hormone-mediated energy conservation mechanisms aimed at preserving fat stores for reproductive function [30]. The rate of weight loss also impacts body composition changes: while no significant differences in FFM loss have been observed between rapid and gradual weight loss, gradual weight loss is associated with a greater reduction in FM, resulting in a higher FM-to-FFM loss ratio [31].
The primary aim was to investigate the effects of weight loss achieved via CR, EX, or a combination of both (CREX) on the circulating concentrations of ghrelin, PYY, GLP-1, and CCK in their total or active forms, and to compare responses among these three interventions. The secondary aim was to identify potential contributors, specifically FFM loss, sex, and rate of weight loss, to hormonal responses after dietary and exercise-induced weight loss as well as to examine the difference between RCTs and non-RCTs. By addressing these aims, this meta-analysis provides a comprehensive overview of appetite-related gut hormone responses to weight loss.
Methods
This systematic review with meta-analysis was conducted according to the Preferred Reporting Items for Systematic Reviews and Meta-analyses (PRISMA) guidelines [32] and was registered prospectively on the PROSPERO database (CRD42022295939).
Search strategy
The following databases were searched for studies in humans published in the English language: PubMed (MEDLINE), EMBASE, SPORTDiscus, Cochrane Library, Web of Science and ClinicalTrials.gov, with no restriction placed on the date of publication (from inception to March 2022), including published abstracts. The reference list of all selected articles and relevant reviews was manually screened to identify additional studies not captured in the initial search. The searches were re-run before the final analysis to identify any further studies that met the inclusion criteria (15th of March 2024). We used search terms related to weight loss, CR or EX interventions, and gut hormone concentrations, with MeSH terms utilised where appropriate (details of the specific search strategy for each database can be found in Supplementary Information Content 1).
Inclusion and exclusion criteria
The following criteria were applied to identify articles for inclusion in this systematic review and meta-analysis:
-
RCTs or non-RCTs.
-
Studies were included if statistically significant weight loss was achieved and at least one of the relevant appetite hormones in total or active form (ghrelin/PYY/GLP-1/CCK) was measured in an overnight fasting state.
-
Participants were adults >18 years of age, with overweight or obesity (BMI ≥ 25 kg/m2). Studies were excluded if the participants were pregnant, had illnesses including diabetes, active infectious disease, severe cardiovascular disease and diseases that require medications affecting body weight or hormone replacement therapy.
-
Studies were included if CR, EX or CREX was one of the interventions. Any dietary intervention that achieved CR, such as the ketogenic diet, Mediterranean diet, or palaeolithic diet, was also included. However, studies were not included if participants completed other interventions together with diet or exercise, such as bariatric surgery or pharmacological treatment.
Selection process
The articles identified were electronically imported into an online software platform (Covidence, Veritas Health Innovation, Melbourne, Australia) for screening and duplicate studies were automatically or manually removed. Three reviewers (ZJ, AT & TS) independently screened the titles and abstracts of retrieved articles to evaluate their eligibility for inclusion in the review and later compared notes to reach a consensus. Potentially relevant articles were sourced, and the full-text articles were screened against the criteria above (ZJ & TS). Any disagreements in study selection were discussed and resolved by discussion or by consulting a third investigator (AT).
Data extraction
Data were extracted by two reviewers (ZJ & JL) independently. Any disagreements were resolved by discussion until consensus was reached or by consulting a third investigator (AT). The following information was extracted: (1) study information (author(s), publication date); (2) study design; (3) sample size (distribution per study arm, attrition); (4) participant characteristics (age, sex, body weight, body mass index, comorbidities, medication use); (5) details of the intervention(s); (6) details of the control arm if RCTs; and (7) appetite-related hormone concentrations (mean pre-intervention, post-intervention and absolute change in concentration with a measure of variance (SD, SEM or 95% CI)). For the studies including assessments at multiple time-points, the data at baseline and immediately after the weight loss phase were extracted for the analysis.
Risk of bias (quality) assessment
Two reviewers (ZJ & JL) independently assessed the quality of the selected studies for risk of bias. Cochrane’s risk-of-bias tool 2.0 [33] was used for assessing RCTs. Items were evaluated in three categories: low risk of bias, some concerns and high risk of bias. The ROBINS-I tool [34] was used to assess risk of bias for non-RCTs. Studies were classified as (1) low risk of bias (2) moderate risk of bias (3) serious risk of bias; (4) critical risk of bias; and (5) no information.
Statistical analysis
A random-effects meta-analysis was conducted using the Metafor package [35] in R version 4.2.2 [36]. This meta-analysis was performed for each appetite-related hormone separately, and the primary analysis focused on the changes of each hormone after weight loss induced by any intervention. Sample size, mean of the changes and SD of the changes for intervention and control (RCTs only) groups were extracted and used in the analyses. In circumstances in which only pre- and post-intervention means and SDs were reported, the correlation coefficient was used to calculate the SD of the changes. Correlations were determined using standard methods of back-calculation from the included studies that provided pre- and post- intervention mean, SD, and SD of the changes [37]. The mean of these correlation coefficients was used in the calculation of relevant effect sizes. Sensitivity analyses were performed incorporating a wide range of correlation coefficients, starting from 0.1 to 0.9 in increments of 0.1. In addition, the sample size, means and the exact p-value of the difference were used from studies where SDs were not available, according to standard methods [37]. Standard error of the mean and confidence intervals (CI) were back calculated to SD, as required, using standard methods [37]. Median and IQR were also back transformed using standard methods [38]. For instances where data was not explicitly reported, we contacted the corresponding authors to request access to the raw data. In cases where data was presented in graphical format within figures, an online tool (WebPlotDigitizer, https://apps.automeris.io/wpd/) was used to extract the numerical values. Standardised mean difference (SMD) was used as the effect size. The effect size was calculated using multilevel modelling to account for the inherent dependency between multiple independent groups originating from the same studies. A minimum of at least five intervention groups was required to perform a meta-analysis of respective variables.
Subgroup analyses were undertaken to investigate the influence of intervention type (CR vs. EX vs. CREX) and study design (RCT vs. non-RCT) for all included studies. In non-RCTs, sensitivity analyses were conducted using a published method [39,40,41] to evaluate the potential influence of unmeasured confounding and other sources of bias. E-values were calculated to estimate the minimum strength of association that an unmeasured confounder would require with both the intervention and the outcome to fully account for the observed associations. Meta-regression analysis was performed to investigate the relationship between changes in appetite hormone concentrations in response to the extent of weight loss (%). The degree of weight change was calculated as follows: formula A (RCTs) and formula B (non-RCTs) were applied for studies reporting the mean of weight changes, and formula C (RCTs) and formula D (non-RCTs) were applied for studies reporting body weight at pre- and post-intervention timepoints:
-
A.
((Mean of the changesint/Pre-weightint) – (Mean of the changescon/Pre-weightcon)) * 100
-
B.
Mean of the changesint/Pre-weightint * 100
-
C.
(((Pre-weightint – Post-weightint)/Pre-weightint) – ((Pre-weightcon – Post-weightcon)/ Pre-weightcon))) * 100
-
D.
((Pre-weightint – Post-weightint)/Pre-weightint) * 100
Subscripts ‘int’ and ‘con’ here mean intervention group and control group. The same calculations were applied to the extent of FFM loss. Exploratory analyses were undertaken to investigate whether the magnitude of FFM loss alone acts as a potential modifier. Additional analyses explored (1) the role of sex on gut hormone changes while controlling for the magnitude of weight loss and (2) the role of the rate of weight loss on gut hormone changes by examining study duration while controlling for the total amount of weight lost. Heterogeneity between trials was estimated using restricted maximum likelihood and assessed using the Chi-squared statistic (Q value) and the I-squared statistic. The Cochrane Handbook offers a rough guide for the interpretation of the I-squared statistic. An I2 value ranging from 0 to 40% may not represent significant heterogeneity. Moderate heterogeneity is indicated by an I2 value between 30 and 60%. Values ranging from 50 to 90% point towards substantial heterogeneity. Lastly, an I2 value of 75% to 100% is indicative of considerable heterogeneity [42]. Case-deletion diagnostics were performed to investigate influential studies within each analysis. This included the determination of externally studentised residuals, dffits (difference in fits) values, Cook’s distances, covariance ratios, estimates of τ2, estimates of the Q-statistic, hat values, weight and dfbetas (difference in fits for beta estimates) values, when each study was removed in turn. Sensitivity analyses were conducted through the repetition of main effect analyses after the exclusion of influential studies, to determine whether these studies markedly affected the overall conclusions. Findings are presented with the inclusion of influential studies if statistical significance was unaffected by their inclusion. Small study effects were explored with funnel plots and Egger’s test. All the analysis and plots were performed using RStudio version 2023.03.0 + 386 running R version 4.2.2 (RStudio, PBC, Boston, MA). P < 0.05 was set as statistical significance.
Results
Search results
The systematic review initially included 128 studies. However, one study [43] was excluded from the meta-analysis due to its exceptionally large effect sizes, which were between ten and twenty times higher than those observed in the other studies and significantly skewed the results according to the sensitivity analyses. Therefore, a total of 127 studies were included, of which 19 studies were RCTs [44,45,46,47,48,49,50,51,52,53,54,55,56,57,58,59,60,61,62] involving 1305 participants, and 108 studies were non-RCTs [11, 63,64,65,66,67,68,69,70,71,72,73,74,75,76,77,78,79,80,81,82,83,84,85,86,87,88,89,90,91,92,93,94,95,96,97,98,99,100,101,102,103,104,105,106,107,108,109,110,111,112,113,114,115,116,117,118,119,120,121,122,123,124,125,126,127,128,129,130,131,132,133,134,135,136,137,138,139,140,141,142,143,144,145,146,147,148,149,150,151,152,153,154,155,156,157,158,159,160,161,162,163,164,165,166,167,168,169] involving 4725 participants. The selection flow diagram is shown in Fig. 1.

Flow diagram of the selection process.
Participants ranged in age from 18 to 70 years, with baseline BMI requirements varying from 25 to 50 kg/m². The weighted average duration of the studies was 20 weeks (ranging from 4 to 52 weeks) for RCTs, and 16 weeks (ranging from 0.5 to 104 weeks) for non-RCTs. On average, RCTs reported a 6% weight loss, while non-RCTs reported a 7% weight loss. CR interventions reported an average weight loss of 9% in RCTs and 7% in non-RCTs. EX interventions elicited a 4% weight loss in RCTs and 3% in non-RCTs. CREX interventions demonstrated a 13% weight loss in RCTs and an 8% weight loss in non-RCTs.
The CR interventions employed an array of approaches, ranging from straightforward daily calorie reduction to more intricate methods. For RCTs, one study applied simple calorie restriction, while three studies combined calorie restriction with macronutrient variations (1 focused on protein maintenance and 2 on restricted fat intake). Additionally, one study utilized intermittent fasting. Among the non-RCTs, 56 studies applied straightforward calorie restriction, with degrees of restriction ranging from very low-calorie diets (550-660 kcal/day) to approximately 1500 kcal/day or achieving a 1000 kcal deficit or 30%-40% of daily energy requirements. Nine studies incorporated macronutrient variations (low carb, low fat, or high protein). Eight studies included food supplements, such as increased dairy product intake to boost Ca2+, fibre from food, cholesterol through eggs, Brazil nuts, and low-fat yogurt. Seven studies used specific diets to achieve calorie restriction, including the Mediterranean diet, vegetarian diet, high or low satiating food, low energy density diet, low glycaemic index diet, fast-mimicking diet, paleo diet, and neurodegenerative delay diet. Four studies altered meal patterns, such as having a heavy breakfast or dinner, consuming carbohydrates at dinner, and varying meal frequency (e.g., 3 or 6 meals per day). Three studies employed intermittent fasting, allowing 0%-25% of energy requirements on fasting days.
The EX interventions included both aerobic training and resistance training. For RCTs, seven studies applied moderate-intensity continuous training (MICT), three studies applied high-intensity interval training (HIIT), and one study combined MICT and HIIT. Four studies focused on resistance training, with one study combining MICT and resistance training, and another combining resistance training and walking. Among non-RCTs, nine studies applied MICT, three applied HIIT, one allowed participants to choose between HIIT or MICT, two combined MICT and HIIT, one focused on resistance training, and one combined MICT with resistance training.
The CREX interventions included a wide array of protocols. For RCTs, one study applied a lifestyle intervention involving telemonitored lifestyle-induced weight loss programmes, and two studies combined CR with MICT. Among non-RCTs, seven studies applied lifestyle interventions aimed at increasing physical activity levels and decreasing energy intake, four studies combined CR with brisk walking, six studies combined CR with MICT (one incorporating a ketogenic diet), two studies combined CR with HIIT, and two studies combined CR with resistance training. Additionally, one study offered a choice between CR with resistance training or MICT (detailed study information is provided in Supplementary Table 1).
Sensitivity analyses across various correlation coefficients demonstrated consistent results (Supplementary Information Content 2). The results discussed below are based on the mean correlation coefficient values obtained from the included studies for each hormone under investigation. The primary analysis aimed to investigate the effects of weight loss achieved via CR, EX, or CREX on circulating appetite-related gut hormone concentrations. Separate meta-analyses were conducted to assess the effects of specific protocols within each intervention type on appetite-related hormones. However, due to a limited number of studies for some protocols, separate analyses were only feasible for examining the effects of MICT on total ghrelin in both RCTs and non-RCTs, as well as on acylated ghrelin in RCTs, and for CR interventions across all hormones in non-RCTs. The results were consistent regardless of whether protocols were analysed individually or grouped by intervention type. Therefore, all protocols within each intervention type were included in the final analysis. A summary graph of these pooled findings, incorporating each intervention type, is presented in Fig. 2.

The dots indicate the overall effect size, and the lines represent the 95% confidence interval. The triangle symbol indicates p < 0.05.
Circulating total ghrelin responses in RCTs
11 RCTs [44, 48, 49, 51, 55,56,57,58,59, 61, 62] were included in the meta-analysis, comprising 5 CR, 9 EX and 2 CREX independent intervention groups, and involving a total of 895 participants (Fig. 3). Findings revealed a pooled SMD of 0.55 (95% CI: 0.07–1.04; p = 0.024) in total ghrelin changes after weight loss with a high level of between-study heterogeneity across studies (I2 = 89%; p < 0.001). Meta-regression analysis identified that each 1% increase in weight loss was associated with a 0.09 (95% CI: 0.01–0.17; p = 0.020) unit increase in the SMD of total ghrelin, which explained 29% of the heterogeneity. The asymmetry in the funnel plot and the Egger’s test result suggests the possibility of publication bias (z = 3.89, p < 0.001, Supplementary Information Content 3 (SI3) - Fig. S1).

N = 11 studies with 16 intervention groups (5 CR, 9 EX, 2 CREX). RE model: random effects model. The weight loss column is defined as follows.1: less than 5% weight loss; 2: 5–10% weight loss, 3: 10–15% weight loss, and 4: 15–20% weight loss. The size of the squares is proportional to the weight of the study in the meta-analysis.
Circulating total ghrelin responses in non-RCTs
The meta-analysis synthesized data from 68 non-RCTs [66, 68, 71, 72, 77,78,79, 81,82,83,84,85, 87,88,89,90, 102,103,104,105,106,107,108,109,110, 112,113,114,115,116,117,118,119,120, 122,123,124,125,126,127,128,129,130,131,132,133,134,135,136,137,138,139,140,141, 148,149,150,151,152, 157,158,159, 162,163,164,165,166,167], incorporating findings from 67 CR, 10 EX and 13 CREX intervention groups, with a cumulative sample size of 3194 participants (Fig. 4). A small-to-moderate pooled SMD of 0.24 (95% CI: 0.14–0.35; p < 0.001) was found, with considerable heterogeneity between studies (I2 = 84%; p < 0.001). Meta-regression revealed that each 1% increase in weight loss was associated with a significant increase of 0.03 SMD for total ghrelin (95% CI: 0.01–0.06; p = 0.013). Egger’s test showed no evidence of publication bias (z = –0.40, p = 0.691) which is supported by the funnel plot (SI3 - Fig. S2).
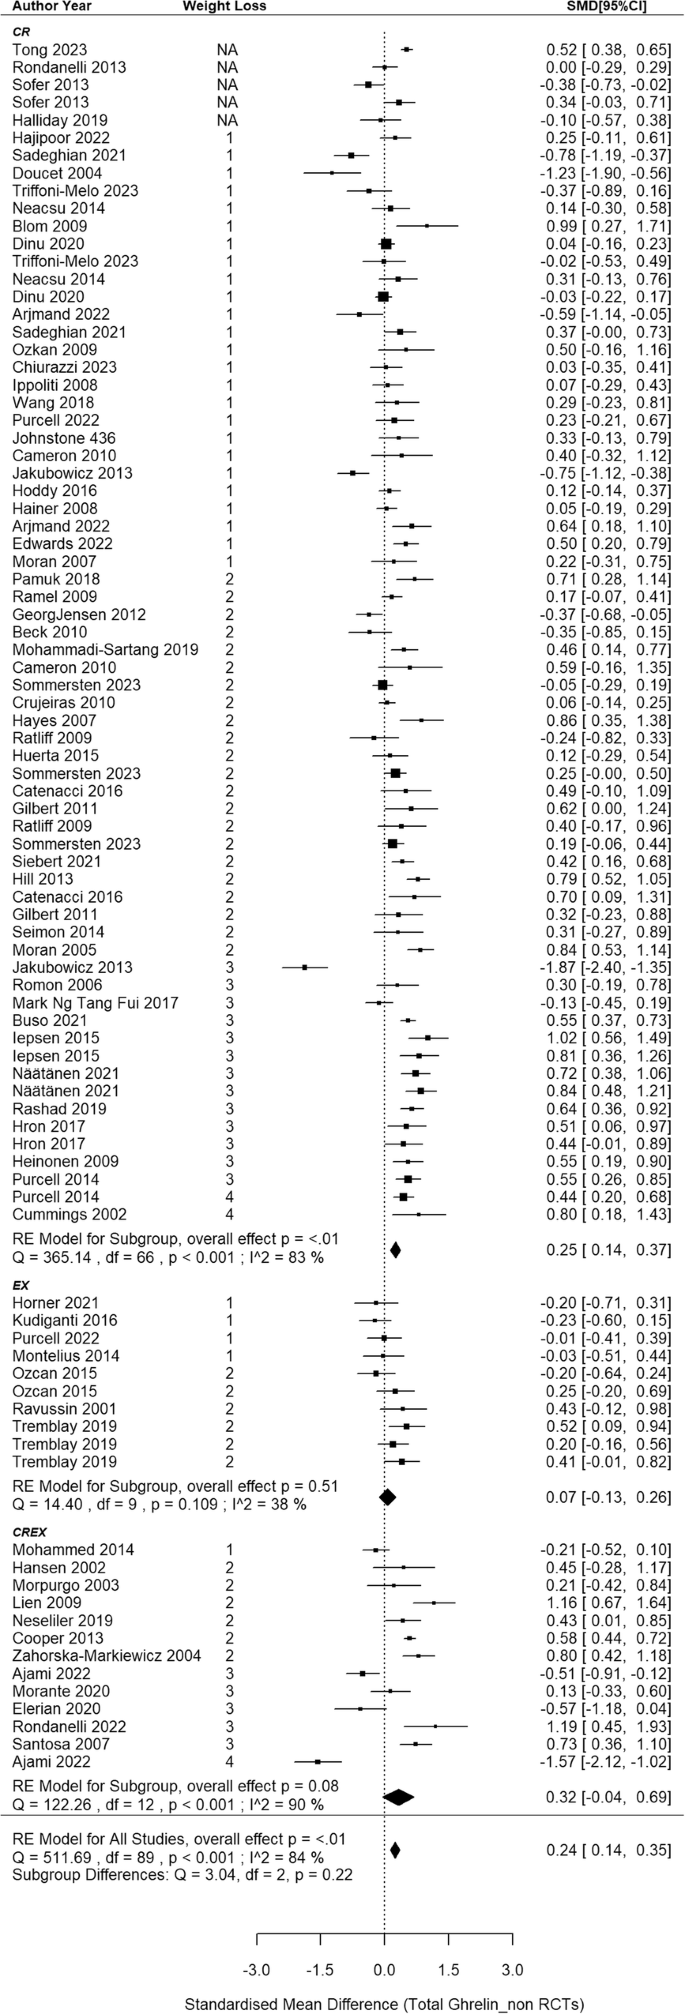
N = 68 studies with 90 intervention groups (67 CR, 10 EX and 13 CREX). RE model: random effects model. The weight loss column is defined as follows.1: less than 5% weight loss; 2: 5–10% weight loss, 3: 10–15% weight loss, and 4: 15–20% weight loss. NA indicates that studies reported significant weight loss without providing exact numbers. The size of the squares in the figure is proportional to the weight of each study in the meta-analysis.
Circulating acylated ghrelin responses in RCTs
8 RCTs [44, 46, 47, 50, 52,53,54, 60] were included in the meta-analysis, comprising 13 independent intervention groups (2 CR and 11 EX only, no CREX group), and involving a total of 288 participants (Fig. 5). Findings revealed a pooled SMD of –0.58 in acylated ghrelin concentration changes after weight loss (95% CI: –1.09 to –0.06; p = 0.028) with substantial between-studies heterogeneity (I2 = 71%, p = 0.004). Meta-regression analyses revealed each 1% increase in weight loss was associated with a 0.14 SMD decrease in acylated ghrelin (95% CI: –0.23 to –0.05, p = 0.004). This finding accounted for 67% of the observed heterogeneity. Furthermore, when this association was considered, the between-study heterogeneity notably decreased and became non-significant (I2 = 33%, p = 0.105). The asymmetry observed in the funnel plot (SI3 - Fig. S3) suggests a potential of publication bias, which is also indicated by the result in the Egger’s test (z = –2.22, p = 0.027).

N = 8 studies and 13 intervention groups (2 CR and 11 EX). RE model: random effects model. The weight loss column is defined as follows.1: less than 5% weight loss; 2: 5–10% weight loss and 3: 10–15% weight loss. The size of the squares is proportional to the weight of the study in the meta-analysis.
Circulating acylated ghrelin responses in non-RCTs
This meta-analysis included 22 non-RCTs [11, 69, 70, 73, 75, 76, 80, 86, 91, 93, 95, 97, 98, 110, 142,143,144,145, 153, 156, 157, 161], aggregating data from 35 independent intervention groups (24 CR, 7 EX and 4 CREX) and comprising 793 participants (Fig. 6). A pooled SMD of 0.15 (95% CI: 0.03 to 0.27; p = 0.015) in acylated ghrelin changes was identified (I2 = 50%; p < 0.001). Meta-regression analysis did not reveal a significant association between weight loss magnitude and acylated ghrelin changes (p = 0.368). The funnel plot appeared to be symmetrical (SI3 - Fig. S4), suggesting a lack of publication bias. This observation is supported by the Egger’s test (z = –0.58; p = 0.562).
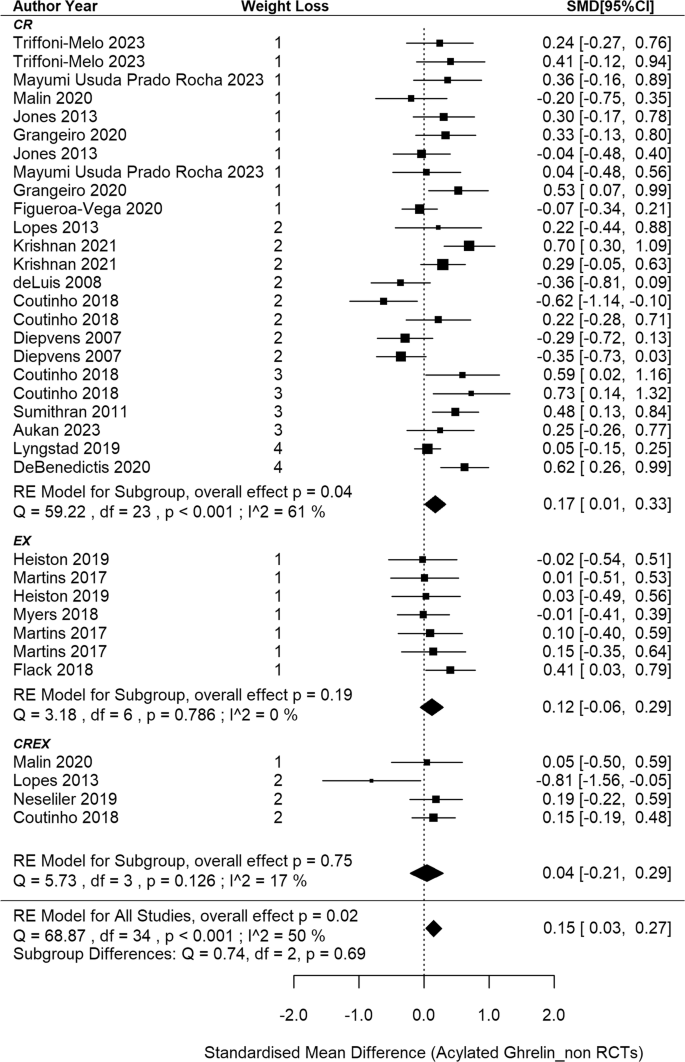
N = 22 studies and 35 intervention groups (24 CR, 7 EX and 4 CREX). RE model: random effects model. The weight loss column is defined as follows.1: less than 5% weight loss; 2: 5–10% weight loss, 3: 10–15% weight loss, and 4: 15–20% weight loss. NA indicates that studies reported significant weight loss without providing exact numbers. The size of the squares in the figure is proportional to the weight of each study in the meta-analysis.
Circulating total PYY responses in RCTs
5 RCTs [46, 47, 50, 53, 54] were included in the meta-analysis, comprising 6 EX groups and 1 CR group across the studies, involving 200 participants (Fig. 7). The meta-analysis revealed a non-significant pooled SMD of 0.33 in total PYY concentrations after weight loss (95% CI: –0.45 to 1.12; p = 0.404) with a substantial heterogeneity (I2 = 83%, p < 0.001). According to meta-regression analysis, a significant positive association was observed between the extent of weight loss and the corresponding changes in PYY concentrations, showing that each 1% increase in weight loss led to a 0.21 SMD increase in PYY (95% CI: 0.11–0.31; p < 0.001), which accounts for 100% of the observed heterogeneity. Similar results were obtained when the analysis included EX interventions only (slope: 0.20, 95%CI: 0.10–0.30, p < 0.001, accounting for 100% of the observed heterogeneity). The symmetry in the funnel plot and the Egger test indicates no publication bias (z = 0.49, p = 0.628; SI3 - Fig. S5).

N = 5 studies and 7 intervention groups (1 CR and 6 EX). RE model: random effects model. The weight loss column is defined as follows.1: less than 5% weight loss; 2: 5–10% weight loss and 3: 10–15% weight loss. The size of the squares is proportional to the weight of the study in the meta-analysis.
Circulating total PYY responses in non-RCTs
This meta-analysis included 31 non-randomised studies [11, 66, 69, 70, 73, 82, 87, 90, 91, 94, 97, 104, 108, 109, 117, 126, 130, 139, 142, 144, 146,147,148,149,150,151,152,153, 155, 156, 158], aggregating data from 41 independent intervention groups and 2 cross-over groups (34 CR, 2EX and 5 CREX), recruiting 1385 participants. A pooled SMD of –0.17 was found in PYY concentration changes after weight loss (95%CI: –0.28 to –0.06, p = 0.002, Fig. 8) with a notable level of heterogeneity among the studies (I2 = 68%; p < 0.001). Meta-regression analysis did not reveal associations between PYY changes and weight loss magnitude (p = 0.081). The asymmetry of the forest plot (SI3 - Fig. S6) and the Egger’s test (z = –3.05, p = 0.002) demonstrated potential publication bias.

N = 31 studies and 41 intervention groups (34 CR, 2EX and 5 CREX). RE model: random effects model. The weight loss column is defined as follows.1: less than 5% weight loss; 2: 5–10% weight loss, 3: 10–15% weight loss, and 4: 15–20% weight loss. The size of the squares is proportional to the weight of the study in the meta-analysis.
Circulating PYY3-36 responses in RCTs
2 RCTs [51, 52] with 5 EX intervention groups were included in this meta-analysis, with a total sample size of 97 (SI3 - Fig. S7). A pooled non-significant SMD of 0.40 was found in PYY3-36 concentration changes after weight loss (95%CI: –0.22 to 1.03, p = 0.206) with a notable level of heterogeneity among the studies (I2 = 66%; p = 0.025). Meta-regression analysis did not reveal associations between PYY3-36 changes and weight loss magnitude (p = 0.305). The asymmetry of the forest plot (SI3 - Fig. S8) and the Egger’s test (z = 2.02, p = 0.043) demonstrated potential publication bias.
Circulating PYY3-36 responses in non-RCTs
In the analysis of non-RCTs, 8 [73, 92, 93, 98, 115, 128, 143, 149] with 14 intervention groups (8 CR, 5 EX and 1 CREX) were included, recruiting 286 participants (SI3 - Figure S9). A pooled SMD of –0.17 was observed (95%CI: –0.32 to –0.02; p = 0.025). The degree of heterogeneity was small and non-significant (I2 = 23%, p = 0.420). Meta-regression analysis elucidated that each 1% increase in weight loss was associated with a 0.03 decrease in the SMD of PYY3-36 concentrations (95%CI: –0.05 to –0.01; p = 0.017) and the heterogeneity I2 reduced to 0%. The asymmetry in the funnel plot (SI3 - Fig. S10) and the Egger’s test indicate potential publication bias (z = 1.97; p = 0.048).
Circulating total GLP-1 responses in RCTs
4 RCTs [45, 50, 52, 54] were included in the meta-analysis, comprising 8 independent groups across the studies (1 CR; 6 EX; 1 CREX), and involving 233 participants (SI3 - Figure S11). The meta-analysis revealed a pooled non-significant SMD of 0.003 (95% CI: –0.47 to 0.47; p = 0.989), along with a moderate degree of between-studies heterogeneity (I2 = 57%, p = 0.045). According to meta-regression analysis, a 1% increase in weight loss was associated with a 0.08 decrease in the pooled SMD of total GLP-1 concentrations (95% CI: –0.14 to –0.03; p = 0.003), which explained 100% of the observed heterogeneity. Potential publication bias was not observed as indicated by the funnel plot and the Egger’s test result (z = –0.20; p = 0.844; SI3 - Fig. S12).
Circulating GLP-1 responses in non-RCTs
This meta-analysis included 22 non-RCTs [73, 82, 87, 90, 98, 99, 111, 121, 142,143,144, 146,147,148,149, 154, 156, 158, 160, 163, 167, 169], aggregating data from 27 independent intervention groups (18 CR, 7 EX; 2 CREX) and comprising 790 individuals (SI3 - Fig. S13). A small and non-significant pooled SMD of –0.07 was reported for the effect of weight loss on total GLP-1 concentration changes (95% CI: –0.20 to 0.06; p = 0.264). The analysis revealed a degree of heterogeneity among the included studies (I2 = 61%, p < 0.001). Meta-regression analysis did not demonstrate any significant relationships between the magnitude of weight loss and changes in GLP-1 concentrations (p = 0.291). The funnel plot is shown in SI3 - Fig. S14. The Egger’s test was not significant (z = –1.77, p = 0.077).
Circulating active GLP-1 responses in non-RCTs
No RCTs were found exploring active GLP-1 changes after weight loss. 18 non-RCTs [11, 63,64,65, 69, 70, 73, 74, 76, 86, 91, 93, 96, 103, 109, 153, 161, 164] were included, with 27 independent and 2 cross-over intervention groups (24 CR and 5 EX groups), involving 757 participants. Given a correlation coefficient could not be calculated from the eligible studies, a correlation coefficient of 0.5 was applied and a series of sensitivity analyses were undertaken. A pooled SMD of -0.16 was observed for the effect of weight loss on active GLP-1 concentration changes (95% CI: –0.28 to –0.05; p = 0.006; SI3 - Fig. S15) with a moderate degree of heterogeneity among the included studies (I2 = 44%, p = 0.008). Meta-regression analysis did not find significant associations between weight loss and active GLP-1 changes (p = 0.082). The funnel plot and Egger’s test did not indicate significant bias (z = 0.36, p = 0.719; SI3 - Figure S16).
Circulating CCK responses in RCTs and non-RCTs
19 studies [11, 50, 54, 67, 69, 70, 73, 76, 93, 100, 101, 104, 111, 117, 142, 149, 153, 156, 159] were included in this quantitative synthesis, of which 2 studies [50, 54] were RCTs, and 17 studies were non-RCTs. Total sample sizes for RCTs and non-RCTs were 126 and 547, respectively. Of the 2 RCTs, there were 4 independent intervention groups, including 3 EX and 1 CR. The 17 non-RCTs, included 21 independent intervention groups, of which the majority were CR (n = 18), followed by CREX (n = 2) and EX (n = 1). The correlation coefficient was set to 0.5 given the lack of correlation coefficients obtained from the incorporated studies.
Since there were only 2 RCTs [50, 54] with 4 intervention groups, we did not perform a meta-analysis. The study [50] applying EX as a weight loss strategy reported no change of basal CCK while CR [54] resulted in a significant decrease of basal CCK. For non-RCTs, a pooled SMD of -0.18 was observed in changes of CCK concentrations after weight loss (95% CI: -0.37 to 0.02; p = 0.076; SI3 - Fig. S17), with a moderate heterogeneity amongst the studies (I2 = 74%, p < 0.001). No association was identified between the extent of weight loss and changes in CCK concentrations (slope: -0.03, 95% CI: -0.06 to 0.01; p = 0.107). The symmetry in the funnel plot and the results from the Egger’s test (z = 0.97, p = 0.332; SI3 - Fig. S18) showed no potential publication bias.
Subgroup analysis: effect of interventions on appetite-hormone changes
Where possible we employed subgroup analysis to gain greater insight into potential differences in the effects of the three interventions (CR, EX, CREX) on appetite related gut hormone concentrations. This was not possible for some outcomes due to an insufficient number of intervention groups (total PYY RCTs, PYY3-36 RCTs, total GLP-1 RCTs). These analyses did not reveal significant differences among interventions for each hormone. Additional analyses were conducted to assess the effects while controlling for the extent of weight loss, but the results remained unchanged. Therefore, the results detailed in each individual forest plot are presented without controlling for the extent of weight loss.
Exploratory analysis for FFM loss, sex, study duration and study design
For body composition changes, the extent of FFM losses correlated positively with increases in total ghrelin for RCTs (slope: 0.21, 95%CI: 0.08–0.34, p = 0.002) and non-RCTs (slope: 0.07, 95%CI: 0.004 to 0.14, p = 0.038). Conversely, there was a negative correlation between changes in total GLP-1 concentrations and changes in FFM from RCTs (slope: −0.12, 95%CI: –0.20 to–0.04, p = 0.002). Similar results were observed when analysing the FFM/FM ratio; however, due to the limited number of studies available for this analysis, these results are not included in the presentation. No differences were identified between studies recruiting females only and males only across all appetite-related hormones (p ≥ 0.176). Mixed-sex cohorts exhibited a 0.33 higher increase in total ghrelin from non-RCTs than female only cohorts (p = 0.005) when weight loss magnitude was held consistent. A positive association was found between study duration and changes in GLP-1 concentrations in non-RCTs, while controlling for the magnitude of weight loss. Specifically, each additional week of intervention was associated with an increase of 0.05 in the SMD of total GLP-1 (95% CI: 0.0002 to 0.010, p = 0.042). No significant differences were identified between RCTs and non-RCTs either overall or in each intervention (p ≥ 0.589), except RCTs elicited 0.78 and 0.73 lower SMD for AG in EX and overall interventions, respectively, compared with non-RCTs (p = 0.020). For non-RCTs, sensitivity analyses using E-values offers a detailed assessment of the robustness of outcomes in relation to potential unmeasured confounding. Total ghrelin, PYY, total GLP-1 and active GLP-1 demonstrated reasonable robustness to moderate confounding. In contrast, acylated ghrelin, PYY3-36, and CCK displayed some sensitivity to confounding, indicating that unmeasured factors may potentially influence their observed effects.
Risk of bias assessment
126 studies were included for the risk of bias assessment because one non-RCT study included in the meta-analysis was only reported in abstract form [162] and hence did not contain sufficient details to conduct a risk of bias assessment. The results are provided in SI3 - Figures S19 and S20. Overall, for the RCTs, the risk of bias was low in 12 studies (63%), moderate in 6 studies (32%) and high in one study (5%). For non-RCTs, the risk of bias was low in 36 studies (34%), moderate in 68 studies (63%) with 1 serious (1%) and 2 critical (2%) risks of bias across studies. Sensitivity analyses were conducted after removing the RCT with high-risk of bias and 3 non-RCTs with serious and critical risk of bias. No significant changes were observed in the SMD after removal of the high-risk studies. However, subgroup analysis showed that for total ghrelin, CR exhibited a 0.53 higher SMD increase compared with EX after removing the high-risk of bias RCT [55]. This difference was absent when controlling for the extent of weight loss. The results excluding the studies classified as high risk of bias are not shown in this meta-analysis.
Discussion
This review summarises: (1) appetite-related gut hormone changes after weight loss in people with overweight or obesity and (2) the differences among interventions involving CR, EX or their combination. This review also identifies potential factors (i.e., loss of FFM, sex, and study duration) that may modify the effect of weight loss on appetite-related gut hormone concentrations. The appetite hormone responses varied by peptide, with an increase in total ghrelin and no changes in total GLP-1 observed in both RCTs and non-RCTs, and inconsistent responses for acylated ghrelin, total PYY and PYY3-36. There was limited data for active GLP-1 and CCK in RCTs, with non-RCTs showing a decrease in active GLP-1 and no change in CCK. Greater weight loss is associated with larger increases in total ghrelin concentrations and varied changes in other appetite-related hormones. No significant differences were identified among the interventions i.e., CR, EX and CREX. Exploratory analysis showed that greater FFM loss was correlated with a greater increase in total ghrelin in both RCTs and non-RCTs, and a greater decrease in total GLP-1 in RCTs. Additionally, shorter study duration, given constant weight loss, was correlated with a greater decrease in total GLP-1 in RCTs.
For the orexigenic hormone ghrelin, a statistically significant increase in total ghrelin after weight loss was identified in RCT and non-RCT studies. Furthermore, a greater magnitude of weight loss was associated with a greater increase in total ghrelin concentrations, suggesting a physiological adaptation after weight loss. However, the results for acylated ghrelin were inconsistent. A decrease of acylated ghrelin was observed in RCTs along with a notable correlation indicating that a greater degree of weight loss corresponded with a larger decrease in acylated ghrelin levels. In contrast, the results summarised from non-RCTs indicated that acylated ghrelin increased after weight loss. Experimental research shows that weight loss induced by caloric restriction or exercise primarily increases total ghrelin by raising plasma levels of des-acyl ghrelin, rather than acylated ghrelin, in individuals with overweight or obesity [44]. Our meta-analysis identified an increase in total ghrelin after weight loss but inconsistent results regarding acylated ghrelin concentrations. One potential explanation for the varied findings on acylated ghrelin is the reduced activity of the GOAT enzyme, which is crucial for the acylation process of ghrelin, under conditions of prolonged energy deficiency [170]. The increase in ghrelin induced by weight loss, combined with a possible GOAT-mediated reduction in acylation, may contribute to the variability in acylated ghrelin concentrations, as one effect could outweigh the other. Additionally, the RCTs primarily involved EX interventions, which may further reduce GOAT activity by redistributing blood flow from the splanchnic region to active muscles [171], although long-term effect remains unclear. Findings from non-RCTs also showed sensitivity to unmeasured confounders. However, measuring appetite-related hormones after an overnight fasting helped mitigate some of these confounding effects. Future studies could explore whether calorie restriction in RCTs also has the potential to decrease acylated ghrelin levels. Despite the differing impacts on acylated ghrelin, des-acyl ghrelin has been reported to stimulate food intake independently of the growth hormone secretagogue receptor-1a (GHSR-1a) in rats [172]. Thus, it is possible that an increase in total ghrelin may increase appetite in humans in the absence of an increase in acylated ghrelin. However, it remains to be determined whether an increase in total ghrelin represents a compensatory response to weight loss, reflecting the body’s effort to counterbalance the energy deficit, or if it indicates a return to pre-overweight values, according to the normalisation theory [73].
Analysis of RCTs showed no significant changes in total PYY and PYY3-36 concentrations after weight loss, while non-RCTs identified a significant decrease in both. This discrepancy may be due to differences in weight loss extent. Most RCTs reported less than 5% weight loss for total PYY, whereas over half of non-RCTs achieved more than 5%. Similarly, for PYY3-36, non-RCTs reported greater weight loss (over 10% in one study with two intervention groups and over 15% in another study), compared to less than 10% in RCTs. Notably, the RCT [47] with resistance training reported the greatest weight loss and the greatest increase in total PYY, contributing to the observed association between greater weight loss and a larger increase in total PYY. Previous research suggests a role for IL-6 in this context, with IL-6 infusion increasing PYY expression [173]. CR or CREX interventions, as opposed to EX alone, have been shown to decrease IL-6 concentrations in people with overweight or obesity, independent of body weight changes [174, 175]. This highlights the potential of exercise in preventing decreases in total PYY during weight loss.
No significant changes in total GLP-1 were observed after weight loss, yet a decrease in active GLP-1 was noted in non-RCTs. Greater weight loss was associated with a greater decrease in total GLP-1 in RCTs, suggesting that changes in this peptide may only become apparent with more substantial weight loss. In addition, the active form of GLP-1 has been recognised for its biological activity. However, recent research has identified that the inactive form, GLP-19–37, may also influence physiological processes, for instance, it may elicit a modest anti-hyperglycaemic effect independent of insulin in humans [176]. This finding suggests that the inactive form of GLP-1 may also have biologically important activity. Therefore, it is critical to determine which form – total or active – responds to a reduced-obesity state.
Regarding CCK, there were not enough RCTs to perform a meta-analysis. The included studies that applied EX indicated no changes in CCK, while CR-induced weight loss led to a decrease in CCK. Both study modes (CR and EX) elicited less than 5% weight loss, suggesting that greater weight loss may be required to elicit changes in CCK. Findings from non-RCTs showed no significant changes in CCK after weight loss. However, sensitivity analyses indicated non-robust results for CCK, suggesting a trend of decreasing CCK concentrations as the correlation coefficient increases and sensitivity to unmeasured confounders.
This is the first meta-analysis that makes direct comparisons between the effects of CR, EX and CREX on appetite related gut hormones. Previous systematic reviews, with or without meta-analysis, have explored the effects of CR and EX separately on appetite-related hormones, suggesting a hormonal response to CR favouring appetite stimulation after weight loss [23, 24], but not EX [25]. Our results showed no differences among interventions for any appetite-related hormone, except that CR led to a greater increase in total ghrelin compared with EX after removing the high-risk of bias RCT study. However, when controlling for the magnitude of weight loss, the variations in total ghrelin changes across different interventions were rendered non-significant. This finding suggests that the differences among interventions might predominantly stem from differing degrees of weight loss. In addition, the results for each intervention, as shown in the forest plot, indicate that CR was associated with a significant increase in total ghrelin and significant decreases in total PYY, PYY3-36, and active GLP-1 after weight loss, while EX elicited a significant decrease in acylated ghrelin and no significant changes in any other hormone. These findings are consistent with the aforementioned reviews [23, 24] that assessed CR and EX separately. However, when examining the extent of weight loss, more CR studies achieved 10–15% or 15–20% weight loss, whereas the EX studies tended to elicit less than 5% or between 5 and 10% weight loss. Therefore, differences in weight loss magnitude could be the reason driving the differences observed in previous reviews and our results for each intervention. The impact of CREX on appetite-related hormones remains uncertain due to the limited number of studies.
In addition, CR and EX might lead to different results due to varied changes in body composition [177]. FFM is considered to influence hormone concentrations. It has been demonstrated that weight loss resulting in FFM deficits leads to higher total [178] and acylated ghrelin [179] concentrations. Our results show that greater FFM loss is correlated with a greater total ghrelin increase in both RCTs and non-RCTs and greater reductions in total GLP-1 concentrations in RCTs. Given the nature of the interventions in the included studies, which predominantly involve CR and aerobic training, these approaches are typically associated with a greater proportion of weight loss coming from FFM [180]. Aerobic training alone is typically less effective in preserving FFM compared with resistance training [177]. Studies in this meta-analysis revealed a significant association between FFM loss and overall weight loss, making it challenging to discern whether observed differences were due to weight loss or FFM loss. This highlights the need for future research that emphasises FFM preservation while promoting fat loss to better elucidate the relationship between FFM and appetite-related hormones.
We also investigated the impact of sex and the rate of weight loss (determined by accounting for study duration) on appetite-related hormone changes while keeping the magnitude of weight loss constant. Research has indicated sex-specific effects on certain appetite-related hormones. For example, active GLP-1 concentrations have been reported to decrease in men, but not in women, after weight loss induced by a very-low-calorie ketogenic diet [153]. Our analysis from non-RCTs revealed that mixed-sex cohorts had greater increases in total ghrelin after weight loss than female-only cohorts, when the extent of weight loss was controlled for.
This finding suggests a potentially stronger effect of weight loss on increasing total ghrelin levels in men than in women. A possible explanation is that men typically have higher baseline FFM and are therefore likely to experience more substantial FFM reductions during weight loss, as predicted by the Forbes curve [181, 182]. This hypothesis is supported by our data: studies with mixed cohorts reported a mean baseline body fat percentage of 41%, compared to 45% in female-only studies, with an average FFM loss of 1.7 kg in mixed cohorts versus 1.1 kg in female-only groups. Additionally, the proportion of FM/FFM loss was 3.5 in mixed cohorts and 3.9 in female-only groups, suggesting a higher FFM loss in mixed cohort than in female groups. The absence of significant differences between male and female-only groups in our analysis might stem from the limited number of studies that recruited exclusively male or female participants, potentially leading to underpowered results. The positive correlation between study duration and total GLP-1 changes when controlling for total weight loss suggests that a slower rate of weight loss may be beneficial in preventing decreases in total GLP-1 levels possibly due to preservation of FFM in current study when the rate of weight loss is slower. Previous research indicates no significant differences in fasting acylated ghrelin, total PYY, active GLP-1, and CCK between rapid and gradual weight loss when the amount of weight loss is controlled for [70]. This is possibly due to changes in body composition being similar regardless of the rate of weight loss provided that total weight loss is similar [183]. Further research is warranted to investigate whether these factors influence appetite-related hormone responses and how this might relate to long-term weight maintenance.
One strength of this meta-analysis is its inclusion of a large number of studies, enabling a comprehensive analysis and the identification of potential modifiers, such as the magnitude of weight loss and body composition changes. However, this breadth also introduces substantial heterogeneity, even though some of the observed heterogeneity was explained by the identified modifiers. The inclusion of studies with varied protocols may raise questions about the rationale behind combining these studies. Unfortunately, while some studies employed specific protocols (e.g., MICT, resistance training, and CR variants like ketogenic diets), we had fewer than five independent groups for many specific protocols. Where feasible, we conducted protocol-specific meta-analyses, and most findings were generally consistent with those from the combined analyses. For many hormones, high heterogeneity persisted even within protocol-specific analyses with larger sample sizes, suggesting that factors beyond intervention protocols—such as measurement variability and natural hormonal fluctuations among participants—may contribute to the heterogeneity observed. We also noted some protocol-specific effects; for instance, resistance training was associated with decreases in AG, while high-fibre diets were linked to increases in CCK. Future studies could investigate the underlying mechanisms driving these protocol-specific responses to provide a clearer understanding of the factors influencing appetite-related hormone changes.
In conclusion, this meta-analysis demonstrates that weight loss triggers a consistent increase in total ghrelin and no changes in total GLP-1, while the results for other appetite-related hormones are variable. The inconsistent results may be related to the amount of weight loss. Additionally, no differences were found among interventions when the amount of weight loss was controlled for. These findings emphasize the necessity for more RCTs of CR and CREX to directly compare various weight-loss interventions and explain potential modifying factors, such as loss of FFM. A key focus for future research should be to determine whether these hormonal responses are predictors of compensation, possibly through mediation analyses examining changes in daily energy intake, or if they represent a normalization to pre-overweight levels.
Data availability
The data presented in this study are accessible through the Loughborough University Research Repository. https://repository.lboro.ac.uk/articles/dataset/Fasting_appetite-related_gut_hormone_responses_after_weight_loss_induced_by_calorie_restriction_exercise_or_both_in_people_with_overweight_or_obesity_a_meta_analysis_/28142897/2?file=51499148.
References
Sarma S, Sockalingam S, Dash S. Obesity as a multisystem disease: trends in obesity rates and obesity-related complications. Diabetes Obes Metab. 2021;23:3–16.
NCD Risk Factor Collaboration (NCD-RisC). Worldwide trends in underweight and obesity from 1990 to 2022: a pooled analysis of 3663 population-representative studies with 222 million children, adolescents, and adults. Lancet 2024;403:1027–50.
Anderson JW, Konz EC, Frederich RC, Wood CL. Long-term weight-loss maintenance: a meta-analysis of US studies. Am J Clin Nutr. 2001;74:579–84.
Busetto L, Bettini S, Makaronidis J, Roberts CA, Halford JCG, Batterham RL. Mechanisms of weight regain. Eur J Intern Med. 2021;93:3–7.
Ibrahim Abdalla MM. Ghrelin - Physiological Functions and Regulation. Eur Endocrinol. 2015;11:90–95.
Sobrino Crespo C, Perianes Cachero A, Puebla Jiménez L, Barrios V, Arilla Ferreiro E. Peptides and food intake. Front Endocrinol (Lausanne). 2014;5:1–13.
Tschöp M, Smiley DL, Heiman ML. Ghrelin induces adiposity in rodents. Nature 2000;407:908–13.
Batterham RL, Cohen MA, Ellis SM, Le Roux CW, Withers DJ, Frost GS, et al. Inhibition of food intake in obese subjects by peptide YY3-36. N. Engl J Med. 2003;349:941–8.
Gutzwiller JP, Göke B, Drewe J, Hildebrand P, Ketterer S, Handschin D, et al. Glucagon-like peptide-1: a potent regulator of food intake in humans. Gut 1999;44:81–86.
Lieverse RJ, Jansen J, Masclee AAM, Lamers C. Satiety effects of cholecystokinin in humans. Gastroenterology 1994;106:1451–4.
Sumithran P, Prendergast LA, Delbridge E, Purcell K, Shulkes A, Kriketos A, et al. Long-term persistence of hormonal adaptations to weight loss. N. Engl J Med. 2011;365:1597–604.
Holliday A, Blannin A. Appetite, food intake and gut hormone responses to intense aerobic exercise of different duration. J Endocrinol. 2017;235:193–205.
Hengist A, Sciarrillo CM, Guo J, Walter M, Hall KD. Gut-derived appetite hormones do not explain energy intake differences in humans following low-carbohydrate versus low-fat diets. Obesity (Silver Spring) 2024;32:1689–98.
Schubert MM, Desbrow B, Sabapathy S, Leveritt M. Acute exercise and subsequent energy intake. A meta-analysis. Appetite 2013;63:92–104.
King JA, Wasse LK, Ewens J, Crystallis K, Emmanuel J, Batterham RL, et al. Differential acylated ghrelin, peptide YY3-36, appetite, and food intake responses to equivalent energy deficits created by exercise and food restriction. J Clin Endocrinol Metab. 2011;96:1114–21.
Ellingsgaard H, Hauselmann I, Schuler B, Habib AM, Baggio LL, Meier DT, et al. Interleukin-6 enhances insulin secretion by increasing glucagon-like peptide-1 secretion from L cells and alpha cells. Nat Med. 2011;17:1481–9.
Chew CH, Choo QC, Lim WS, Lao KM, Wong SY, Chow XH. IL-6 possibly modulates ghrelin expression through MEK1/p90RSK signaling cascade in pancreatic cell lines. Cytokine 2014;70:34.
Wu R, Dong W, Ji Y, Zhou M, Marini CP, Ravikumar TS, et al. Orexigenic hormone ghrelin attenuates local and remote organ injury after intestinal ischemia-reperfusion. PLoS One. 2008;3:e2026.
Doucet E, Imbeault P, St-Pierre S, Alméras N, Mauriège P, Richard D, et al. Appetite after weight loss by energy restriction and a low-fat diet–exercise follow-up. Int J Obes. 2000;24:906–14.
Nymo S, Coutinho SR, Eknes PH, Vestbostad I, Rehfeld JF, Truby H, et al. Investigation of the long-term sustainability of changes in appetite after weight loss. Int J Obes. 2018;42:1489–99.
King NA, Caudwell PP, Hopkins M, Stubbs JR, Naslund E, Blundell JE. Dual-process action of exercise on appetite control: increase in orexigenic drive but improvement in meal-induced satiety23. Am J Clin Nutr. 2009;90:921–7.
Martins C, Kulseng B, King NA, Holst JJ, Blundell JE. The effects of exercise-induced weight loss on appetite-related peptides and motivation to eat. J Clin Endocrinol Metab. 2010;95:1609–16.
Zhao X, Han Q, Gang X, Lv Y, Liu Y, Sun C, et al. The role of gut hormones in diet-induced weight change: a systematic review. Horm Metab Res. 2017;49:816–25.
Tacad DKM, Tovar AP, Richardson CE, Horn WF, Krishnan GP, Keim NL, et al. Satiety associated with calorie restriction and time-restricted feeding: peripheral hormones. Adv Nutr. 2022;13:792–820.
Almesbehi T, Harris L, McGarty A, Alqallaf S, Westrop S, Edwards CA, et al. Effects of exercise training programmes on fasting gastrointestinal appetite hormones in adults with overweight and obesity: A systematic review and meta-analysis. Appetite 2023;182:106424.
Hopkins M, Gibbons C, Blundell J. Fat-free mass and resting metabolic rate are determinants of energy intake: Implications for a theory of appetite control. Philos Trans R Soc Lond B Biol Sci. 2023;378:20220213.
Grannell A, Kokkinos A, le Roux CW. Myokines in appetite control and energy balance. Muscles. 2022;1:26–47.
Filigheddu N, Gnocchi VF, Coscia M, Cappelli M, Porporato PE, Taulli R, et al. Ghrelin and des-acyl ghrelin promote differentiation and fusion of C2C12 skeletal muscle cells. Mol Biol Cell. 2007;18:986–94.
Angelino E, Reano S, Bollo A, Ferrara M, De Feudis M, Sustova H, et al. Ghrelin knockout mice display defective skeletal muscle regeneration and impaired satellite cell self-renewal. Endocrine 2018;62:129–35.
Hagobian TA, Sharoff CG, Stephens BR, Wade GN, Silva JE, Chipkin SR, et al. Effects of exercise on energy-regulating hormones and appetite in men and women. Am J Physiol Regul Integr Comp Physiol. 2009;296:233–42.
Ashtary-Larky D, Bagheri R, Abbasnezhad A, Tinsley GM, Alipour M, Wong A. Effects of gradual weight loss v. rapid weight loss on body composition and RMR: a systematic review and meta-analysis. Br J Nutr. 2020;124:1121–32.
Page MJ, McKenzie JE, Bossuyt PM, Boutron I, Hoffmann TC, Mulrow CD, et al. The PRISMA 2020 statement: an updated guideline for reporting systematic reviews. BMJ 2021;372:n71.
Sterne JAC, Savović J, Page MJ, Elbers RG, Blencowe NS, Boutron I, et al. RoB 2: a revised tool for assessing risk of bias in randomised trials. BMJ 2019;366:l4898.
Sterne JAC, Hernán MA, Reeves BC, Savović J, Berkman ND, Viswanathan M, et al. ROBINS-I: a tool for assessing risk of bias in non-randomised studies of interventions. BMJ 2016;355:I4919.
Viechtbauer W. Conducting meta-analyses in R with the metafor Package. J Stat Softw. 2010;36:1–48.
R Core Team (2022) R: A Language and Environment for Statistical Computing. R Foundation for Statistical Computing, Vienna. https://www.R-project.org.
Higgins JPT, Li T, Deeks JJ. Chapter 6: Choosing effect measures and computing estimates of effect. In: Higgins JPT, Thomas J, Chandler J, Cumpston M, Li T, Page MJ, Welch VA (editors). Cochrane Handbook for Systematic Reviews of Interventions version 6.5 (last updated August 2023). Cochrane, (2024).
Wan X, Wang W, Liu J, Tong T. Estimating the sample mean and standard deviation from the sample size, median, range and/or interquartile range. BMC Med Res Methodol. 2014;14:135.
Mathur MB, VanderWeele TJ. Methods to address confounding and other biases in meta-analyses: review and recommendations. Annu Rev Public Health. 2022;43:19–35.
VanderWeele TJ, Ding P. Sensitivity analysis in observational research: introducing the E-value. Ann Intern Med. 2017;167:268–74.
Mathur MB, Ding P, Riddell CA, VanderWeele TJ. Web site and R package for computing E-values. Epidemiology 2018;29:e45–e47.
Deeks JJ, Higgins JPT, Altman DG (editors). Chapter 10: Analysing data and undertaking meta-analyses. In: Higgins JPT, Thomas J, Chandler J, Cumpston M, Li T, Page MJ, et al. (editors). Cochrane Handbook for Systematic Reviews of Interventions version 6.4 (updated August 2023). Cochrane, (2023).
Ataeinosrat A, Haghighi MM, Abednatanzi H, Soltani M, Ghanbari-Niaki A, Nouri-Habashi A, et al. Effects of three different modes of resistance training on appetite hormones in males with obesity. Front Physiol. 2022;13:827335.
Barazzoni R, Gortan Cappellari G, Zanetti M, Klaus KA, Semolic A, Johnson ML, et al. Higher unacylated ghrelin and insulin sensitivity following dietary restriction and weight loss in obese humans. Clin Nutr. 2021;40:638–44.
Biemann R, Penner M, Borucki K, Westphal S, Luley C, Rönicke R, et al. Serum bile acids and GLP-1 decrease following telemetric induced weight loss: results of a randomized controlled trial. Sci Rep. 2016;6:30173.
Guelfi KJ, Donges CE, Duffield R. Beneficial effects of 12 weeks of aerobic compared with resistance exercise training on perceived appetite in previously sedentary overweight and obese men. Metabolism 2013;62:235–43.
Rostamzadeh N, Sheikholeslami-Vatani D. Appetite regulating hormones and body composition responses to resistance training and detraining in men with obesity: a randomized clinical trial. Sport Sci Health. 2022;18:115–23.
Mager U, Kolehmainen M, de Mello VDF, Schwab U, Laaksonen DE, Rauramaa R, et al. Expression of ghrelin gene in peripheral blood mononuclear cells and plasma ghrelin concentrations in patients with metabolic syndrome. Eur J Endocrinol. 2008;158:499–510.
Mason C, Xiao L, Imayama I, Duggan CR, Campbell KL, Kong A, et al. The effects of separate and combined dietary weight loss and exercise on fasting ghrelin concentrations in overweight and obese women: a randomized controlled trial. Clin Endocrinol (Oxf). 2015;82:369–76.
Quist JS, Blond MB, Gram AS, Steenholt CB, Janus C, Holst JJ, et al. Effects of active commuting and leisure-time exercise on appetite in individuals with overweight and obesity. J Appl Physiol. 2019;126:941–51.
Rosenkilde M, Reichkendler MH, Auerbach P, Toräng S, Gram AS, Ploug T, et al. Appetite regulation in overweight, sedentary men after different amounts of endurance exercise: A randomized controlled trial. J Appl Physiol. 2013;115:1599–609.
Shakiba E, Sheikholeslami-Vatani D, Rostamzadeh N, Karim H. The type of training program affects appetite-regulating hormones and body weight in overweight sedentary men. Appl Physiol Nutr Metab. 2019;44:282–7.
Sheikholeslami-Vatani D, Rostamzadeh N. Changes in appetite-dependent hormones and body composition after 8 weeks of high-intensity interval training and vitamin D supplementation in sedentary overweight men. Front Nutr. 2022;9:827630.
Zouhal H, Bagheri R, Triki R, Saeidi A, Wong A, Hackney AC, et al. Effects of ramadan intermittent fasting on gut hormones and body composition in males with obesity. Int J Environ Res Public Health. 2020;17:1–15.
Kang SJJ, Kim JHH, Gang Z, Yook YSS, Yoon JRR, Ha GCC, et al. Effects of 12-week circuit exercise program on obesity index, appetite regulating hormones, and insulin resistance in middle-aged obese females. J Phys Ther Sci. 2018;30:169–73.
Redman LM, Veldhuis JD, Rood J, Smith SR, Williamson D, Ravussin E, et al. The effect of caloric restriction interventions on growth hormone secretion in nonobese men and women. Aging Cell. 2010;9:32–39.
Foster-Schubert KE, McTiernan A, Frayo RS, Schwartz RS, Rajan KB, Yasui Y, et al. Human plasma ghrelin levels increase during a one-year exercise program. J Clin Endocrinol Metab. 2005;90:820–5.
Sun S, Kong Z, Shi Q, Zhang H, Lei OK, Nie J. Carbohydrate restriction with or without exercise training improves blood pressure and insulin sensitivity in overweight women. Healthcare (Basel). 2021;9:637.
Ahmadi SM, Fathi M, RashidLamir A, Aminian F. Effects of 8 weeks aerobic training on plasma ghrelin level and ghrelin lymphocyte gene expression in elderly men. Salmand Iran J Ageing. 2019;13:494–505.
Valinejad A, Khodaei K. Does exercise during a ketogenic diet effectively alter appetite sensation, appetite-regulating hormones, and body composition? Exp Biol Med. 2022;247:1898–906.
Hu M, Shi Q, Sun S, Hong HI, Zhang H, Qi F, et al. Effect of a low-carbohydrate diet with or without exercise on anxiety and eating behavior and associated changes in cardiometabolic health in overweight young women. Front Nutr. 2022;9:1–11.
Mohammad M, Karim D, Mehdi M, Marziyeh S, Hadi S, Shila N. The combinatory effect of spirulina supplementation and resistance exercise on plasma contents of adipolin, apelin, ghrelin, and glucose in overweight and obese men. Mediators Inflamm. 2022;2022:9539286.
Adam TC, Lejeune MP, Westerterp-Plantenga MS. Nutrient-stimulated glucagon-like peptide 1 release after body-weight loss and weight maintenance in human subjects. Br J Nutr. 2006;95:160–7.
Berggren J, Lindqvist A, Hedenbro J, Groop L, Wierup N. Roux-en-Y gastric bypass versus calorie restriction: support for surgery per se as the direct contributor to altered responses of insulin and incretins to a mixed meal. Surg Obes Relat Dis. 2017;13:234–42.
Brzozowska MM, Tran T, Bliuc D, Jorgensen J, Talbot M, Fenton-Lee D, et al. Roux-en-Y gastric bypass and gastric sleeve surgery result in long term bone loss. Int J Obes. 2021;45:235–46.
Cameron JD, Cyr MJ, Doucet É. Increased meal frequency does not promote greater weight loss in subjects who were prescribed an 8-week equi-energetic energy-restricted diet. Br J Nutr. 2010;103:1098–101.
Chearskul S, Delbridge E, Shulkes A, Proietto J, Kriketos A. Effect of weight loss and ketosis on postprandial cholecystokinin and free fatty acid concentrations. Am J Clin Nutr. 2008;87:1238–46.
Cooper JN, Fried L, Tepper P, et al. Changes in serum aldosterone are associated with changes in obesity-related factors in normotensive overweight and obese young adults. Hypertens Res. 2013;36:895–901.
Coutinho SR, Halset EH, Gåsbakk S, Rehfeld JF, Kulseng B, Truby H, et al. Compensatory mechanisms activated with intermittent energy restriction: A randomized control trial. Clin Nutr. 2018;37:815–23.
Coutinho SR, With E, Rehfeld JF, Kulseng B, Truby H, Martins C. The impact of rate of weight loss on body composition and compensatory mechanisms during weight reduction: a randomized control trial. Clin Nutr. 2018;37:1154–62.
Crujeiras AB, Goyenechea E, Abete I, Lage M, Carreira MC, Martínez JA, et al. Weight regain after a diet-induced loss is predicted by higher baseline leptin and lower ghrelin plasma levels. J Clin Endocrinol Metab. 2010;95:5037–44.
Cummings DE, Weigle DS, Frayo RS, Breen PA, Ma MK, Dellinger EP, et al. Plasma ghrelin levels after diet-induced weight loss or gastric bypass surgery. N. Engl J Med. 2002;346:1623–30.
DeBenedictis JN, Nymo S, Ollestad KH, Boyesen GA, Rehfeld JF, Holst JJ, et al. Changes in the homeostatic appetite system after weight loss reflect a normalization toward a lower body weight. J Clin Endocrinol Metab. 2020;105:2538–46.
de Luis DA, Sagrado MG, Conde R, Aller R, Izaola O. The effects of two different hypocaloric diets on glucagon-like peptide 1 in obese adults, relation with insulin response after weight loss. J Diabetes Compl. 2009;23:239–43.
de Luis DA, Sagrado MG, Conde R, Aller R, Izaola O. Changes of ghrelin and leptin in response to hypocaloric diet in obese patients. Nutrition 2008;24:162–6.
Diepvens K, Soenen S, Steijns J, Arnold M, Westerterp-Plantenga M. Long-term effects of consumption of a novel fat emulsion in relation to body-weight management. Int J Obes (Lond). 2007;31:942–9.
Dinu M, Colombini B, Pagliai G, Cesari F, Gori A, Giusti B, et al. Effects of a dietary intervention with Mediterranean and vegetarian diets on hormones that influence energy balance: results from the CARDIVEG study. Int J Food Sci Nutr. 2020;71:362–9.
Doucet E, Pomerleau M, Harper ME. Fasting and postprandial total ghrelin remain unchanged after short-term energy restriction. J Clin Endocrinol Metab. 2004;89:1727–32.
Elerian AE, Ali Abdeen HA, Elmakaky A, Mostafa MS. Efficacy of gender, anaerobic exercise and low calorie diet on leptin, ghrelin hormones and hunger perception: A comparative study. Obes Med. 2020;18:100213.
Figueroa-Vega N, Marín-Aragón CI, López-Aguilar I, Ibarra-Reynoso L, Pérez-Luque E, Manuel Malacara J. Analysis of the percentages of monocyte subsets and ILC2s, their relationships with metabolic variables and response to hypocaloric restriction in obesity. PLoS One. 2020;15:1–19.
Gilbert JAA, Joanisse DR, Chaput JPP, Miegueu P, Cianflone K, Alméras N, et al. Milk supplementation facilitates appetite control in obese women during weight loss: A randomised, single-blind, placebo-controlled trial. Br J Nutr. 2011;105:133–43.
Halliday TM, Polsky S, Schoen JA, Legget KT, Tregellas JR, Williamson KM, et al. Comparison of surgical versus diet-induced weight loss on appetite regulation and metabolic health outcomes. Physiol Rep. 2019;7:1–15.
Hansen TK, Dall R, Hosoda H, Kojima M, Kangawa K, Christiansen JS, et al. Weight loss increases circulating levels of ghrelin in human obesity. Clin Endocrinol (Oxf). 2002;56:203–6.
Hayes MR, Miller CK, Ulbrecht JS, Mauger JL, Parker-Klees L, Gutschall MD, et al. A carbohydrate-restricted diet alters gut peptides and adiposity signals in men and women with metabolic syndrome. J Nutr. 2007;137:1944–50.
Heinonen MV, Laaksonen DE, Karhu T, Karhunen L, Laitinen T, Kainulainen S, et al. Effect of diet-induced weight loss on plasma apelin and cytokine levels in individuals with the metabolic syndrome. Nutr Metab Cardiovasc Dis. 2009;19:626–33.
Heiston EM, Eichner NZM, Gilbertson NM, Gaitan JM, Kranz S, Weltman A, et al. Two weeks of exercise training intensity on appetite regulation in obese adults with prediabetes. J Appl Physiol 2019;126:746–754.
Hoddy KK, Gibbons C, Kroeger CM, Trepanowski JF, Barnosky A, Bhutani S, et al. Changes in hunger and fullness in relation to gut peptides before and after 8 weeks of alternate day fasting. Clin Nutr. 2016;35:1380–5.
Horner KM, Byrne NM, King NA. Effect of combined interval and continuous exercise training on gastric emptying, appetite, and adaptive responses in men with overweight and obesity. Front Nutr. 2021;8:1–11.
Jakubowicz D, Barnea M, Wainstein J, Froy O. High Caloric intake at breakfast vs. dinner differentially influences weight loss of overweight and obese women. Obesity 2013;21:2504–12.
Johnstone AM, Kelly J, Ryan S, Romero-Gonzalez R, McKinnon H, Fyfe C, et al. Nondigestible carbohydrates affect metabolic health and gut microbiota in overweight adults after weight loss. J Nutr. 2020;150:1859–70.
Jones KW, Eller LK, Parnell JA, Doyle-Baker PK, Edwards AL, Reimer RA. Effect of a dairy- and calcium-rich diet on weight loss and appetite during energy restriction in overweight and obese adults: a randomized trial. Eur J Clin Nutr. 2013;67:371–6.
Kelly KR, Brooks LM, Solomon TP, Kashyap SR, O’Leary VB, Kirwan JP. The glucose-dependent insulinotropic polypeptide and glucose-stimulated insulin response to exercise training and diet in obesity. Am J Physiol Endocrinol Metab. 2009;296:1269–74.
Krishnan S, Adams SH, Witbracht MG, Woodhouse LR, Piccolo BD, Thomas AP, et al. Weight loss, but not dairy composition of diet, moderately affects satiety and postprandial gut hormone patterns in adults. J Nutr. 2021;151:245–54.
Liu MZ, Liu YT, Yang LB. Effect of acupuncture on serum PYY and nesfatin-1 in obese patients with insulin resistance. J Acupunct Tuina Sci. 2021;19:432–7.
Lopes AL, Fayh APT, de Souza Campos LG, Teixeira BC, Carteri RBK, Ribeiro JL, et al. The effects of diet- and diet plus exercise-induced weight loss on basal metabolic rate and acylated ghrelin in grade 1 obese subjects. Diabetes Metab Syndr Obes 2013;6:469–475.
Malin SK, Francois ME, Eichner NZM, Gilbertson NM, Heiston EM, Fabris C, et al. Impact of short-term exercise training intensity on β-cell function in older obese adults with prediabetes. J Appl Physiol. 2018;125:1979–86.
Malin SK, Heiston EM, Gilbertson NM, Eichner NZM. Short-term interval exercise suppresses acylated ghrelin and hunger during caloric restriction in women with obesity. Physiol Behav. 2020;223:112978.
Martins C, Aschehoug I, Ludviksen M, Holst J, Finlayson G, Wisloff U, et al. High-intensity interval training, appetite, and reward value of food in the obese. Med Sci Sports Exerc. 2017;49:1851–8.
Maurer L, Mai K, Krude H, Haynes JD, Weygandt M, Spranger J. Interaction of circulating GLP-1 and the response of the dorsolateral prefrontal cortex to food-cues predicts body weight development. Mol Metab 2019;29:136–144.
Martins C, Kulseng B, Rehfeld JF, King NA, Blundell JE. Effect of chronic exercise on appetite control in overweight and obese individuals. Med Sci Sports Exerc. 2013;45:805–12.
Mathus-Vliegen EMH, van Ierland-van Leeuwen ML, Bennink RJ. Influences of fat restriction and lipase inhibition on gastric emptying in obesity. Int J Obes (Lond). 2006;30:1203–10.
Mohammed MA, Anwar R, Mansour AH, Elmasry E, Othman G. Effects of intragastric balloon versus conservative therapy on appetite regulatory hormones in obese subjects. Trends Med Res 2014;9:58–80.
Montelius C, Erlandsson D, Vitija E, Stenblom EL, Egecioglu E, Erlanson-Albertsson C, et al. Body weight loss, reduced urge for palatable food and increased release of GLP-1 through daily supplementation with green-plant membranes for three months in overweight women. Appetite 2014;81:645–646.
Moran LJ, Noakes M, Clifton PM, Wittert GA, Le Roux CW, Ghatei MA, et al. Postprandial ghrelin, cholecystokinin, peptide YY, and appetite before and after weight loss in overweight women with and without polycystic ovary syndrome. Am J Clin Nutr. 2007;86:1603–10.
Moran LJ, Luscombe-Marsh ND, Noakes M, Wittert GA, Keogh JB, Clifton PM. The satiating effect of dietary protein is unrelated to postprandial ghrelin secretion. J Clin Endocrinol Metab. 2005;90:5205–11.
Hernández Morante JJ, Díaz Soler I, Muñoz JSG, Sánchez HP, Barberá Ortega MDC, Martínez CM, et al. Moderate weight loss modifies leptin and ghrelin synthesis rhythms but not the subjective sensations of appetite in obesity patients. Nutrients 2020;12:916.
Morpurgo PS, Resnik M, Agosti F, Cappiello V, Sartorio A, Spada A. Ghrelin secretion in severely obese subjects before and after a 3-week integrated body mass reduction program. J Endocrinol Invest. 2003;26:723–7.
Näätänen M, Kolehmainen M, Laaksonen DE, Herzig KHH, Poutanen K, Karhunen L. Post-weight loss changes in fasting appetite- and energy balance-related hormone concentrations and the effect of the macronutrient content of a weight maintenance diet: a randomised controlled trial. Eur J Nutr. 2021;60:2603–16.
Neacsu M, Fyfe C, Horgan G, Johnstone AM. Appetite control and biomarkers of satiety with vegetarian (soy) and meat-based high-protein diets for weight loss in obese men: a randomized crossover trial. Am J Clin Nutr. 2014;100:548–58.
Neseliler S, Hu W, Larcher K, Zacchia M, Dadar M, Scala SG, et al. Neurocognitive and Hormonal Correlates of Voluntary Weight Loss in Humans. Cell Metab. 2019;29:39–49.
Nobile V, Duclos E, Michelotti A, Bizzaro G, Negro M, Soisson F. Supplementation with a fish protein hydrolysate (Micromesistius poutassou): effects on body weight, body composition, and CCK/GLP-1 secretion. Food Nutr Res. 2016;60:29857.
Ozcan O, Bostanci MO, Cicek G, Yamaner F. The effects of two different exercise programmes on adipose tissue hormones in sedentary middle-aged women. Arch Physiol Biochem 2015;121:50–55.
Ozkan Y, Aydin S, Donder E, Koca SS, Aydin S, Ozkan B, et al. Effect of orlistat on the total ghrelin and leptin levels in obese patients. J Physiol Biochem. 2009;65:215–23.
Rashad NM, Saraya YS, Afifi SA, Ali AE, Al-sayed RM. Impact of weight loss on plasma ghrelin level, clinical, and metabolic features of obese women with or without polycystic ovary syndrome. Middle East Fertil Soc J 2019;24:12.
Ratliff J, Mutungi G, Puglisi MJ, Volek JS, Fernandez ML. Carbohydrate restriction (with or without additional dietary cholesterol provided by eggs) reduces insulin resistance and plasma leptin without modifying appetite hormones in adult men. Nutr Res. 2009;29:262–8.
Romon M, Gomila S, Hincker P, Soudan B, Dallongeville J. Influence of weight loss on plasma ghrelin responses to high-fat and high-carbohydrate test meals in obese women. J Clin Endocrinol Metab. 2006;91:1034–41.
Seimon RV, Taylor P, Little TJ, Noakes M, Standfield S, Clifton PM, et al. Effects of acute and longer-term dietary restriction on upper gut motility, hormone, appetite, and energy-intake responses to duodenal lipid in lean and obese men. Am J Clin Nutr. 2014;99:24–34.
Sofer S, Eliraz A, Kaplan S, Voet H, Fink G, Kima T, et al. Changes in daily leptin, ghrelin and adiponectin profiles following a diet with carbohydrates eaten at dinner in obese subjects. Nutr Metab Cardiovasc Dis. 2013;23:744–50.
Tremblay A, Dutheil F, Drapeau V, Metz L, Lesour B, Chapier R, et al. Long-term effects of high-intensity resistance and endurance exercise on plasma leptin and ghrelin in overweight individuals: the RESOLVE Study. Appl Physiol Nutr Metab. 2019;44:1172–9.
Zahorska-Markiewicz B, Mizia-Stec K, Olszanecka-Glinianowicz M, Janowska J. Effect of weight reduction on serum ghrelin and TNFα concentrations in obese women. Eur J Intern Med. 2004;15:172–5.
Hassanzadeh-Rostami Z, Abbasi A, Faghih S. Effects of biscuit fortified with whey protein isolate and wheat bran on weight loss, energy intake, appetite score, and appetite regulating hormones among overweight or obese adults. J Funct Foods. 2020;70:103743.
Blom WAM, de Graaf C, Lluch A, Stafleu A, Schaafsma G, Hendriks HFJ. Postprandial ghrelin responses are associated with the intermeal interval in time-blinded normal weight men, but not in obese men. Physiol Behav 2009;96:742–748.
Catenacci VA, Pan Z, Ostendorf D, Brannon S, Gozansky WS, Mattson MP, et al. A randomized pilot study comparing zero-calorie alternate-day fasting to daily caloric restriction in adults with obesity. Obesity (Silver Spring) 2016;24:1874–1883.
Kudiganti V, Kodur RR, Kodur SR, Halemane M, Deep DK. Efficacy and tolerability of Meratrim for weight management: a randomized, double-blind, placebo-controlled study in healthy overweight human subjects. Lipids Health Dis. 2016;15:136.
Georg Jensen M, Kristensen M, Astrup A. Effect of alginate supplementation on weight loss in obese subjects completing a 12-wk energy-restricted diet: a randomized controlled trial. Am J Clin Nutr. 2012;96:5–13.
Hill BR, Rolls BJ, Roe LS, De Souza MJ, Williams NI. Ghrelin and peptide YY increase with weight loss during a 12-month intervention to reduce dietary energy density in obese women. Peptides 2013;49:138–44.
Huerta AE, Navas-Carretero S, Prieto-Hontoria PL, Martinez JA, Moreno-Aliaga MJ. Effects of alpha-lipoic acid and eicosapentaenoic acid in overweight and obese women during weight loss. Obesity (Silver Spring) 2015;23:313–321.
Iepsen EW, Lundgren J, Dirksen C, Jensen JE, Pedersen O, Hansen T, et al. Treatment with a GLP-1 receptor agonist diminishes the decrease in free plasma leptin during maintenance of weight loss. Int J Obes (Lond). 2015;39:834–41.
Ippoliti F, Liguori A, Petti F, Canitano N, Rughini S. Leptin, ghrelin and TNF-alpha before and after hypo-caloric traditional Chinese diet and auricular acupuncture. J Tradit Chin Med. 2008;28:24–33.
Lien LF, Haqq AM, Arlotto M, Slentz CA, Muehlbauer MJ, McMahon RL, et al. The STEDMAN project: biophysical, biochemical and metabolic effects of a behavioral weight loss intervention during weight loss, maintenance, and regain. OMICS. 2009;13:21–35.
Pamuk B, Yilmaz H, Kebapcilar L, Kirbiyik H, Alacacioglu A, Bozkaya G, et al. The effect of orlistat and weight loss diet on plasma ghrelin and obestatin. J Res Med Sci. 2018;23:95.
Mohammadi-Sartang M, Mazloomi SM, Fararouie M, Bedeltavana A, Famouri M, Mazloom Z. Daily fortified-synbiotic yogurt consumption facilitates appetite control in overweight and obese adults with metabolic syndrome during a weight-loss program: a 10-week randomized controlled trial. Prog Nutr. 2019;21:135–44.
Purcell K, Sumithran P, Prendergast LA, Bouniu CJ, Delbridge E, Proietto J. The effect of rate of weight loss on long-term weight management: a randomised controlled trial. Lancet Diabetes Endocrinol. 2014;2:954–962.
Ramel A, Parra D, Martinéz JA, Kiely M, Thorsdottir I. Effects of seafood consumption and weight loss on fasting leptin and ghrelin concentrations in overweight and obese European young adults. Eur J Nutr. 2009;48:107–14.
Ravussin E, Tschӧp M, Morales S, Bouchard C, Heiman ML. Plasma ghrelin concentration and energy balance: overfeeding and negative energy balance studies in twins. J Clin Endocrinol Metab. 2001;86:4547.
Sadeghian M, Hosseini SA, Javid AZ, Angali KA, Mashkournia A, Kambiz, et al. Effect of fasting-mimicking diet or continuous energy restriction on weight loss, body composition, and appetite-regulating hormones among metabolically healthy women with obesity: a randomized controlled, parallel trial. Obes Surg. 2021;31:2030–9.
Santosa S, Demonty I, Lichtenstein AH, Cianflone K, Jones PJHH. An investigation of hormone and lipid associations after weight loss in women. J Am Coll Nutr. 2007;26:250–8.
Rondanelli M, Opizzi A, Perna S, Faliva M, Solerte SB, Fioravanti M, et al. Improvement in insulin resistance and favourable changes in plasma inflammatory adipokines after weight loss associated with two months’ consumption of a combination of bioactive food ingredients in overweight subjects. Endocrine 2013;44:391–401.
Siebert JC, Stanislawski MA, Zaman A, Ostendorf DM, Konigsberg IR, Jambal P, et al. Multiomic predictors of short-term weight loss and clinical outcomes during a behavioral-based weight loss intervention. Obesity (Silver Spring). 2021;29:859–869.
Wang X, Sparks JR, Bowyer KP, Youngstedt SD. Influence of sleep restriction on weight loss outcomes associated with caloric restriction. Sleep. 2018;41:1–11.
Rondanelli M, Perna S, Ilyas Z, Peroni G, Bazire P, Sajuox I, et al. Effect of very low-calorie ketogenic diet in combination with omega-3 on inflammation, satiety hormones, body composition, and metabolic markers. A pilot study in class I obese subjects. Endocrine. 2022;75:129–36.
Coutinho SR, Rehfeld JF, Holst JJ, Kulseng B, Martins C. Impact of weight loss achieved through a multidisciplinary intervention on appetite in patients with severe obesity. Am J Physiol Endocrinol Metab. 2018;315:91–98.
Flack KD, Ufholz K, Johnson L, Fitzgerald JS, Roemmich JN. Energy compensation in response to aerobic exercise training in overweight adults. Am J Physiol Regul Integr Comp Physiol. 2018;315:619–26.
Myers A, Dalton M, Gibbons C, Finlayson G, Blundell J. Structured, aerobic exercise reduces fat mass and is partially compensated through energy intake but not energy expenditure in women. Physiol Behav. 2019;199:56–65.
Grangeiro ÉD, Trigueiro MS, Siais LO, et al. Hypocaloric diet with lower meal frequency did not affect weight loss, body composition and insulin responsiveness, but improved lipid profile: a randomized clinical trial. Food Funct. 2021;12:12594–605.
Lim JJ, Liu Y, Lu LW, Barnett D, Sequeira IR, Poppitt SD. Does a higher protein diet promote satiety and weight loss independent of carbohydrate content? an 8-week low-energy diet (LED) intervention. Nutrients 2022;14:538.
Rabiei S, Hedayati M, Rashidkhani B, Saadat N, Shakerhossini R. The effects of synbiotic supplementation on body mass index, metabolic and inflammatory biomarkers, and appetite in patients with metabolic syndrome: a triple-blind randomized controlled trial. J Diet Suppl. 2019;16:294–306.
Ng Tang Fui M, Hoermann R, Grossmann M. Effect of testosterone treatment on adipokines and gut hormones in obese men on a hypocaloric diet. J Endocr Soc. 2017;1:302–12.
Batterham MJ, Beck EJ, Huang XF, Tapsell LC, Tosh SM, Batterham MJ, et al. Oat β-glucan supplementation does not enhance the effectiveness of an energy-restricted diet in overweight women. Br J Nutr. 2010;103:1212–22.
Buso MEC, Seimon RV, McClintock S, Muirhead R, Atkinson FS, Brodie S, et al. Can a higher protein/low glycemic index vs. a conventional diet attenuate changes in appetite and gut hormones following weight loss? a 3-year PREVIEW sub-study. Front Nutr. 2021;8:1–12.
Hainer V, Hlavatá K, Gojová M, Kunešová M, Wagenknecht M, Kopský V, et al. Hormonal and psychobehavioral predictors of weight loss in response to a short-term weight reduction program in obese women. Physiol Res 2008;57:S17–27.
Hron BM, Ebbeling CB, Feldman HA, Ludwig DS. Hepatic, adipocyte, enteric and pancreatic hormones: response to dietary macronutrient composition and relationship with metabolism. Nutr Metab (Lond). 2017;14:44.
Lyngstad A, Nymo S, Coutinho SR, et al. Investigating the effect of sex and ketosis on weight-loss-induced changes in appetite. Am J Clin Nutr. 2019;109:1511–8.
Bowes A, Begley J, Kerr D. Lifestyle change reduces cardiometabolic risk factors and glucagon-like peptide-1 levels in obese first-degree relatives of people with diabetes. J Hum Nutr Diet. 2017;30:490–8.
McNeil J, Schwartz A, Rabasa-Lhoret R, Lavoie JM, Brochu M, Doucet É. Changes in leptin and peptide YY do not explain the greater-than-predicted decreases in resting energy expenditure after weight loss. J Clin Endocrinol Metab. 2015;100:443–52.
Aukan MI, Skårvold S, Brandsaeter IØ, Rehfeld JF, Holst JJ, Nymo S, et al. Gastrointestinal hormones and appetite ratings after weight loss induced by diet or bariatric surgery. Obesity (Silver Spring). 2023;31:399–411.
Triffoni-Melo AT, Castro M, Jordão AA, Leandro-Merhi VA, Dick-DE-Paula I, Diez-Garcia RW. High-fiber diet promotes metabolic,hormonal, and satiety effects inobese women on a short-term caloric restriction. Arq Gastroenterol. 2023;60:163–71.
Purcell SA, Legget KT, Halliday TM, Pan Z, Creasy SA, Blankenship JM, et al. Appetitive and metabolic responses to an exercise versus dietary intervention in adults with obesity. Transl J Am Coll Sports Med. 2022;7:e000211.
Chiurazzi M, De Conno B, Di Lauro M, et al. The effects of a cinchona supplementation on satiety, weight loss and body composition in a population of overweight/obese adults: a controlled randomized study. Nutrients 2023;15:5033.
Åkerström T, Stolpe MN, Widmer R, Dejgaard TF, Højberg JM, Møller K, et al. Endurance training improves GLP-1 sensitivity and glucose tolerance in overweight women. J Endocr Soc 2022;6:bvac111.
Mayumi Usuda Prado Rocha D, Paula Silva Caldas A, Simões E Silva AC, Bressan J, Hermana Miranda Hermsdorff H. Nut-enriched energy restricted diet has potential to decrease hunger in women at cardiometabolic risk: a randomized controlled trial (Brazilian Nuts Study). Nutr Res. 2023;109:35–46.
Tong J, Heianza Y, Schur EA, Sacks F, Qi L, Boyko EJ. Rise in fasting ghrelin level in response to weight loss predicts future weight regain in the POUNDS LOST Trial. J Endocr Soc 2023;7:bvad114.084.
Hajipoor S, Hekmatdoost A, Pasdar Y, Mohammadi R, Alipour M, Rezaie M, et al. Consumption of probiotic yogurt and vitamin D-fortified yogurt increases fasting level of GLP-1 in obese adults undergoing low-calorie diet: a double-blind randomized controlled trial. Food Sci Nutr. 2022;10:3259–71.
Edwards KAL, Prendergast LA, Kalfas S, Sumithran P, Proietto J. Impact of starting BMI and degree of weight loss on changes in appetite-regulating hormones during diet-induced weight loss. Obesity (Silver Spring). 2022;30:911–9.
Sommersten CH, Gjerde ES, Laupsa-Borge J, Andersen AI, Lawrence-Archer L, McCann A, et al. Relationship between ketones, ghrelin, and appetite on isocaloric diets with varying carbohydrate quality and amount: results from a randomized controlled trial in people with obesity (CARBFUNC). J Nutr. 2023;153:459–69.
Ajami M, Kagawa M, Roshanmehr F, McKian SS, Radfar M, Vazirijavid R, et al. Narrative-focused group counseling improves intervention outcomes in women with obesity. J Nutr Educ Behav. 2022;54:894–901.
Arjmand G, Abbas-Zadeh M, Fardaei M, Eftekhari MH. The effect of Short-term Mediterranean-DASH Intervention for Neurodegenerative Delay (MIND) Diet on Hunger Hormones, Anthropometric Parameters, and Brain Structures in Middle-aged Overweight and Obese Women: A Randomized Controlled Trial. Iran J Med Sci. 2022;47:422–32.
Ragland TJ, Malin SK. Plasma LEAP-2 following a low-calorie diet with or without interval exercise in women with obesity. Nutrients 2023;15:655.
Otten J, Ryberg M, Mellberg C, Andersson T, Chorell E, Lindahl B, et al. Postprandial levels of GLP-1, GIP and glucagon after 2 years of weight loss with a Paleolithic diet: a randomised controlled trial in healthy obese women. Eur J Endocrinol. 2019;180:417–27.
Kirchner H, Gutierrez JA, Solenberg PJ, Pfluger PT, Czyzyk TA, Willency JA, et al. GOAT links dietary lipids with the endocrine control of energy balance. Nat Med. 2009;15:741–5.
Broom DR, Stensel DJ, Bishop NC, Burns SF, Miyashita M. Exercise-induced suppression of acylated ghrelin in humans. J Appl Physiol. 2007;102:2165–71.
Toshinai K, Yamaguchi H, Sun Y, Smith RG, Yamanaka A, Sakurai T, et al. Des-Acyl ghrelin induces food intake by a mechanism independent of the growth hormone secretagogue receptor. Endocrinology 2006;147:2306–14.
Islam H, Townsend LK, McKie GL, Medeiros PJ, Gurd BJ, Hazell TJ. Potential involvement of lactate and interleukin-6 in the appetite-regulatory hormonal response to an acute exercise bout. J Appl Physiol. 2017;123:614–23.
Nicklas BJ, Ambrosius W, Messier SP, Miller GD, Penninx BWJH, Loeser RF, et al. Diet-induced weight loss, exercise, and chronic inflammation in older, obese adults: a randomized controlled clinical trial. Am J Clin Nutr. 2004;79:544–51.
Imayama I, Ulrich CM, Alfano CM, Wang C, Xiao L, Wener MH, et al. Effects of a caloric restriction weight loss diet and exercise on inflammatory biomarkers in overweight/obese postmenopausal women: a randomized controlled trial. Cancer Res. 2012;72:2314–26.
Meier JJ, Gethmann A, Nauck MA, Gӧtze O, Schmitz F, Deacon CF, et al. The glucagon-like peptide-1 metabolite GLP-1-(9–36) amide reduces postprandial glycemia independently of gastric emptying and insulin secretion in humans. Am J Physiol Endocrinol Metab. 2006;290:1118–23.
Clark JE. Diet, exercise or diet with exercise: comparing the effectiveness of treatment options for weight-loss and changes in fitness for adults (18–65 years old) who are overfat, or obese; systematic review and meta-analysis. J Diabetes Metab Disord. 2015;14:31.
Rigamonti AE, Agosti F, De Col A, Marazzi N, Lafortuna CL, Cella SG, et al. Changes in plasma levels of ghrelin, leptin, and other hormonal and metabolic parameters following standardized breakfast, lunch, and physical exercise before and after a multidisciplinary weight-reduction intervention in obese adolescents. J Endocrinol Invest. 2010;33:633–9.
Martins C, Nymo S, Coutinho SR, Rehfeld JF, Hunter GR, Gower BA. Association between fat-free mass loss, changes in appetite, and weight regain in individuals with obesity. J Nutr. 2023;153:1330–7.
Chaston TB, Dixon JB, O’Brien PE. Changes in fat-free mass during significant weight loss: a systematic review. Int J Obes. 2007;31:743–50.
Forbes GB. Body fat content influences the body composition response to nutrition and exercise. Ann NY Acad Sci. 2000;904:359–65.
Hall KD. Body fat and fat-free mass inter-relationships: Forbes’s theory revisited. Br J Nutr 2007;97:1059–63.
Fogarasi A, Gonzalez K, Dalamaga M, Magkos F. The impact of the rate of weight loss on body composition and metabolism. Curr Obes Rep. 2022;11:33–44.
Acknowledgements
This research was supported by the National Institute for Health and Care Research (NIHR) Leicester Biomedical Research Centre. The views expressed are those of the authors and not necessarily those of the NHS, the NIHR or the Department of Health.
Author information
Authors and Affiliations
Contributions
ZJ and DJS were responsible for designing the review protocol. ZJ, AET, JAK and DJS were responsible for writing the protocol. ZJ and AET were responsible for conducting the search. ZJ, AT and TS were responsible for screening potentially eligible studies. ZJ and JL were responsible for extracting data and conducting risk of bias assessment. ZJ and KD were responsible for analysing data and interpreting results. ZJ and DJS was responsible for writing the report. All co-authors provided feedback on the report.
Corresponding author
Ethics declarations
Competing interests
The authors declare no competing interests.
Additional information
Publisher’s note Springer Nature remains neutral with regard to jurisdictional claims in published maps and institutional affiliations.
Supplementary information
Rights and permissions
Open Access This article is licensed under a Creative Commons Attribution 4.0 International License, which permits use, sharing, adaptation, distribution and reproduction in any medium or format, as long as you give appropriate credit to the original author(s) and the source, provide a link to the Creative Commons licence, and indicate if changes were made. The images or other third party material in this article are included in the article’s Creative Commons licence, unless indicated otherwise in a credit line to the material. If material is not included in the article’s Creative Commons licence and your intended use is not permitted by statutory regulation or exceeds the permitted use, you will need to obtain permission directly from the copyright holder. To view a copy of this licence, visit http://creativecommons.org/licenses/by/4.0/.
About this article

Cite this article
Jin, Z., Li, J., Thackray, A.E. et al. Fasting appetite-related gut hormone responses after weight loss induced by calorie restriction, exercise, or both in people with overweight or obesity: a meta‐analysis. Int J Obes 49, 776–792 (2025). https://doi.org/10.1038/s41366-025-01726-4
Received:
Revised:
Accepted:
Published:
Issue date:
DOI: https://doi.org/10.1038/s41366-025-01726-4
