
Abstract
Background
Serum PSA and digital rectal examination remain the key diagnostic tools for detecting prostate cancer. However, due to the limited specificity of serum PSA, the applicability of this marker continues to be controversial. Recent use of image-guided biopsy along with pathological assessment and the use of biomarkers has dramatically improved the diagnosis of clinically significant cancer. Despite the two modalities working together for diagnosis biomarker research often fails to correlate findings with imaging.
Methods and results
We looked at 21 prostate cancer biomarkers correlating our results with mpMRI data to investigate the hypothesis that biomarkers along with mpMRI data make a powerful tool to detect clinically significant prostate cancer. Biomarkers were selected based on the existing literature. Using a tissue microarray comprised of samples from the PICTURE study, with biopsies at 5 mm intervals and mpMRI data we analysed which biomarkers could differentiate benign and malignant tissue. Biomarker data were also correlated with pathological grading, mpMRI, serum PSA, age and family history. AGR2, CD10 and EGR protein expression was significantly different in both matched malignant and benign tissues. AMACR, ANPEP, GDF15, MSMB, PSMA, PTEN, TBL1XR1, TP63, VPS13A and VPS28 showed significantly different expression between Gleason grades in malignant tissue. The majority of the biomarkers tested did not correlate with mpMRI data. However, CD10, KHDRBS3, PCLAF, PSMA, SIK2 and GDF15 were differentially expressed with prostate cancer progression. AMACR and PTEN were identified in both pathological and image data evaluation.
Conclusions
There is a high demand to develop biomarkers that would help the diagnosis and prognosis of prostate cancer. Tissue biomarkers are of particular interest since immunohistochemistry remains a cheap, reliable method that is widely available in pathology departments. These results demonstrate that testing biomarkers in a cohort consistent with the current diagnostic pathway is crucial to identifying biomarker with potential clinical utility.

Introduction
An early and accurate diagnosis of prostate cancer (PCa), and its timely treatment, are the key components in managing the disease and outcome. Traditionally, the measurement of serum prostate-specific antigen (PSA), alongside digital rectal exam, is used as gold standard in PCa detection [1, 2]. More recently the use of multiparametric MRI imaging (mpMRI) with image-guided biopsy, Gleason grading and clinical stage has contributed enormously to the improved diagnosis and risk stratification of PCa [3, 4]. As a minimally invasive technique, mpMRI has also eliminated unnecessary biopsies and supported individual treatment plans that require either more aggressive therapies or active surveillance. There are limited data available for biomarkers in conjunction with imaging, even though it plays an increasingly important role in the diagnostic pathway.
PCa is a multifocal, heterogenous disease making accurate diagnosis and prognosis challenging. This results in a demand for better diagnostic tools to accurately identify those cancers that will limit survival and to stratify those patients that can be safely managed with active surveillance [5, 6]. Fluidic and tissue-based diagnostic biomarkers are increasingly abundant. Despite the plethora of tests available, many are not cost-effective and have not been routinely adopted [5, 7,8,9,10]. Meanwhile, immunohistochemistry (IHC) remains routinely performed in the majority of pathology laboratories and offers a cost-effective method for improving diagnosis using clinical samples that are routinely available.
The work presented here investigates 21 biomarkers selected through the literature searches and unpublished data obtained in our laboratory. We focused on markers previously associated with PCa; however, many of them are also associated with other cancers (Table 1).
Biomarkers were analysed in a cohort of 249 patients from the PICTURE study, utilising a tissue microarray (TMA) comprising malignant biopsy cores paired with matched adjacent benign tissue for each patient, resulting in a total of 449 core sections per patient. These results were conducted in conjunction with mpMRI and diagnostic clinical data. Notably, many of the biomarkers investigated in this study provide the first dataset to be examined alongside imaging data or provide additional validation in a larger dataset. Additionally, our analysis encompassed the evaluation of pathological Gleason scores and biopsy grade groups (GG) to determine the correlation between the clinically significant and clinically insignificant disease with image data. This comprehensive approach allows for a detailed understanding of PCa pathology, combining traditional histopathological grading with emerging biomarker insights and imaging modalities.
Material and methods
Tissue microarray
The TMA is comprised of biopsy cores from 249 patients enroled in the PICTURE trial that investigated the accuracy of mpMRI to diagnose clinically significant prostate cancer (csPCa) [11, 12]. csPCa was defined based on TPM (template prostate mapping) biopsy, Gleason grade and maximum cancer core length (MCCL) measures. The primary definition of significance was based on the presence of dominant Gleason pattern 4 or greater (Gleason ≥4 + 3) and/or a MCCL of ≥6 mm. This was the primary objective of the study. Further to this, a definition two for the secondary outcome analysis (Gleason ≥3 + 4 and/or MCCL ≥ 4 mm) as well as the presence of any Gleason score 7 or more was used. Clinically insignificant disease was defined as Gleason pattern 3 and MCCL ≤ 3 mm. Therefore, tissue with the highest pathological Gleason score and/or the longest MCCL was used to construct the TMA as described [11]. There were three categories of samples: true benign (patients whose tissue was assessed as benign, no cancer), malignant tissue (patients diagnosed with PCa) and adjacent, benign tissue (sometimes refer as matched benign tissue; a neighbouring benign tissue that comes from the same biopsy core as malignant sample). A summary of patient clinical data can be found in Supplementary Table 1. Ethics committee approval for PICTURE was granted by London City Road and Hampstead National Research Ethics Committee (11/LO/1657) and all procedures were in accordance with the Helsinki Declaration. Informed consent was obtained from all individual participants included in the study.
Biomarker selection
Biomarkers were identified through literature searches and prioritised based upon published data that was indicative of a role in diagnosis in PCa as well as the availability of high-quality reagents for IHC. Other markers were selected as they form part of ongoing experiments and unpublished data obtained within the laboratory. A list of the biomarkers tested can be found in Table 1.
Immunohistochemistry
IHC was performed using a Leica BOND-MAX Autostainer (Leica Biosystems, Milton Keynes, UK). Dewaxing and rehydration took planning manually in advance. Antibodies were optimised using imperfect TMA slides and stained with antibodies diluted in either primary antibody diluent (Leica Biosystems, Milton Keynes, UK) or a high stringency diluent for enhanced target specificity (10× Tris buffered-saline (TBS)) (Trizma Base, Sigma-Aldrich, Gillingham, UK), 10% donkey serum (Sigma-Aldrich, Gillingham, UK) and 1% Tween (Fisher Scientific, Loughborough, UK). Heat- induced epitope retrieval was performed with either Epitope Retrieval solution 1 (ER1, pH 6.0, Leica Biosystems, Milton Keynes, UK) or Epitope Retrieval solution 2 (ER2, pH 9.0, Leica Biosystems, Milton Keynes UK).
Full-face TMA slides were stained for 21 biomarkers and an overview of the optimised conditions can be found in Table 2. Diaminobenzidine (DAB) was used as the chromogen (brown) and haematoxylin used to counterstain the nuclei (blue). Slides underwent manual dehydration before they were cover-slipped with DPX (Merck Millipore, Gillingham, UK).
Immunohistochemistry scoring
Slides were digitised using a Hamamatsu RS 2.0 scanner and viewed using the NDP.view software. All scoring was performed blindly in pairs by HW and one other researcher (USF, VS, ZA, BS, MA, HQ, JK, JO, and LMCE). The proportion of positively stained epithelial cells (0–100%) was assessed in the cancer and benign tissue and the intensity of the staining assessed (0 = none, 1 = weak, 2 = medium and 3 = strong). A final score ranging from 0-300 was carried out by using the histochemical scoring (h-score) assessment [13, 14] with the following formula: (percentage of score 3 × 3) + (percentage of score 2 × 2) + (percentage of score 1 × 1).
A total of 449 core segments were stained using IHC against 21 biomarkers, resulting in ~9427 stained core sections. A summary of these findings is presented in Supplementary Tables 2 and 3. Out of these 532 (5.6%) cores were stromal, and 1358 (14.4%) were either lost during the staining process or deemed unassessable due to poor tissue quality.
Where both tumour and benign tissue were present in a core only tumour tissue was scored. Cores identified as stromal, unassessable (poor quality or inadequate tissue present) and/or missing were excluded from further analysis. Following the exclusion, 7537 (79.9%) cores were included in the analysis with 6565 (87.1%) cores showing agreement in appearance on IHC and H&E originally intended (‘as assigned’).
A small proportion of cores needed to be re-assigned as benign or tumour compared to the initial pathological evaluation but the tissue comes from the same core (Supplementary Tables 2 and 3). The pathology of a proportion of cores, or cores where the pathology was ambiguous, was double-checked by uropathologist AF and AH. All Gleason scores were provided by AF and AH.
Data analysis and statistics
Statistical analysis was performed using the R programme (http://www.R-project.org/, version 4.0.2). The h-score of matched data identified as tumour and adjacent benign (tissue present in the same core with cancer tissue) was analysed alongside additional clinical data e.g. pathological Gleason grade, Likert score, serum PSA, age, ethnicity and family history. For the matched data analysis, the paired Wilcoxon signed rank test was used due to the non-normal distribution of the data. For comparison of multiple groups, the Kruskal-Wallis analysis of variation with the Wilcoxon signed rank test and Dunn test with Bonferroni p-adjustment were used. The statistical significance level of p < 0.05 was considered significant.
Results
Expression of biomarkers differentiates benign and cancerous tissue
Matched tissue from 249 patients underwent IHC staining for biomarkers previously associated with malignancy (Fig. 1). The h-scores for each marker, based on the intensity and number of positively stained cells, are shown in Fig. 2. Boxplots show the h-scores in cancer and adjacent benign tissue while the density plots show the distribution of the mean h-score between cancer and patient-matched benign tissue (Fig. 2 and Supplementary Fig. 1).

All prostatic tissue slices were processed, stained using BOND-MAX Autostainer, and reviewed to assess the staining intensity of each biomarker in benign (b) and tumour (t) tissue. The staining of AGR2, AMACR, ANPEP, AR, CD10, ERG, GDF15, KHDRBS3, MSMB, PCLAF, NAALADL2, NKX3.1, PSA, PSMA, PTEN, SIK2, TBL1XR1, TP63, TRMT12, VPS13A and VPS28 are shown in brown and nuclei shown in blue. Full details of all staining conditions can be found in Table 1. Each marker was scored using the h-score method. The white and black arrowheads in some examples refer to benign and tumour tissues in a malignant core.
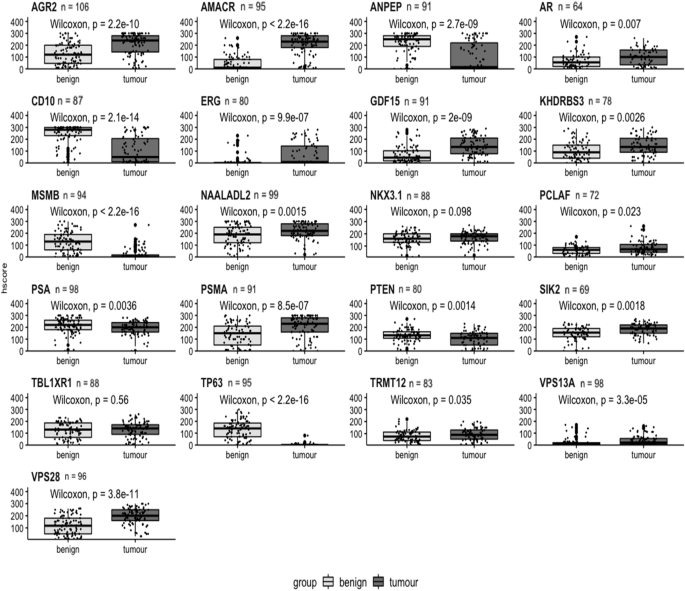
Boxplots comparing matched benign and cancer samples based on h-score for each biomarker. Benign tissue plotted as light grey; cancer tissue as dark grey. H-score plotted on y-axis. Benign and cancer plotted on x-axis. Biomarker name above each boxplot with n = number of patients. A Wilcoxon signed rank test was performed and p values shown on each graph.
Using the Wilcoxon signed-rank test only two markers, NKX3.1 and TBL1XR1, were not statistically significant (Fig. 2). The remaining 19 biomarkers did show significantly different expression at the protein level between tumour and benign tissue; AGR2, AMACR, ANPEP, CD10, ERG, GDF15, MSMB, TP63, PSMA, VPS13A and VPS28 highly significantly (p < 0.001) and AR, KDHRBS3, NAALADL2, PSA, PTEN and SIK2 having a significance of p < 0.01. PCLAF and TRMT12 had a significance of p < 0.05. In the density plots, 13 biomarkers showed a significant difference between benign and malignant tissue: AGR2, AMACR, ANPEP, AR, CD10, ERG, GDF15, KHDRBS3, MSMB, NAALADL2, TP63, PSA, PSMA, SIK2, TRMT12 VPS13A and VPS28. Other biomarkers showed no significant difference between the mean h-score values; PCLAF, NKX3.1, PTEN and TBL1XR1 (Supplementary Fig. 1).
Identification of biomarkers that can distinguish pathological grading
To assess the relationship between h-score and prostate pathology the highest Gleason score (i.e. the most aggressive) and/or the longest MCCL for each patient was compared. Analysis of h-scores of different pathological groups, identified 13 biomarkers in malignant tissue that were highly statistically significant (Kruskal-Wallis rank sum p ≤ 0.001) in comparison to true benign tissue: AGR2, AMACR, ANPEP, CD10, ERG, GDF15, MSMB, PSMA, PTEN, TBL1XR1, TP63, VPS13A and VPS28 (Fig. 3). Of these 13 biomarkers, at least one pathological group within the marker showed significant difference between Gleason grades compared to true benign group with AGR2, CD10, PSMA and VPS28 showing significance in all pathological groups (Fig. 3). The remaining identified markers were significantly different between ≤2 Gleason groups.
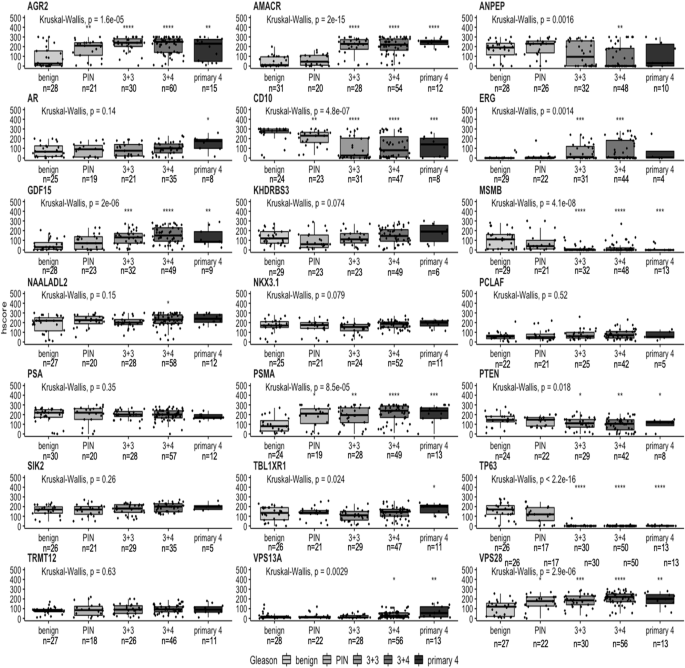
Boxplots comparing the IHC h-score with Gleason grades in malignant tissue for each biomarker. The pathological comparison is based on patients’ biopsies classified as true benign (benign), prostatic intraepithelial neoplasia (PIN) and Gleason grading system: 3 + 3, 3 + 4 and primary 4 (4 + 3, 4 + 4 and 4 + 5). Pathological groups plotted on x-axis. H-score plotted on y-axis. Biomarker name above each boxplot graph. Number of patients (n) is displayed below each pathological group. Kruskal-Wallis rank sum test was performed with p value displayed above each boxplot. Each Gleason group was compared to true benign group (benign), a reference group, with t-test with *p < 0.05, **p < 0.01, ***p < 0.001 and ****p < 0.0001.
For the matched benign cores, AGR2, CD10 and ERG showed the highest degree of significance (Supplementary Fig. 2). Among those markers, a post hoc analysis showed that only AGR2 had a significant difference in all four pathological groups when compared to the true benign group. No significant correlation was shown for the rest of the biomarkers in adjacent benign cores.
Identification of biomarkers that show clinically significant PCa on mpMRI
As the visibility of cancer on mpMRI correlates with higher Gleason grade and the presence of clinically significant cancer, we investigated if the h-score correlated with mpMRI conspicuity. The Likert score and biomarker h-score were compared in matched samples based on two groups: less conspicuous, Likert ≤ 3 (‘lower’ and/or ‘equivocal’ likelihood of a clinically significant cancer diagnosis) and more conspicuous Likert ≥ 4 (‘higher’ likelihood of a clinically significant cancer diagnosis). In both malignant and adjacent benign cores, AMACR was identified as highly significant marker with p values of 0.0054 and 0.034, respectively (Fig. 4 and Supplementary Fig. 3). SIK2 (p = 0.0013), AR (p = 0.025) and PTEN (p = 0.027) also showed a significant difference in expression at the protein level detected by IHC in malignant tissue. The rest of the biomarkers showed no statistical difference between malignant and adjacent benign tissue (Fig. 4 and Supplementary Fig. 3).
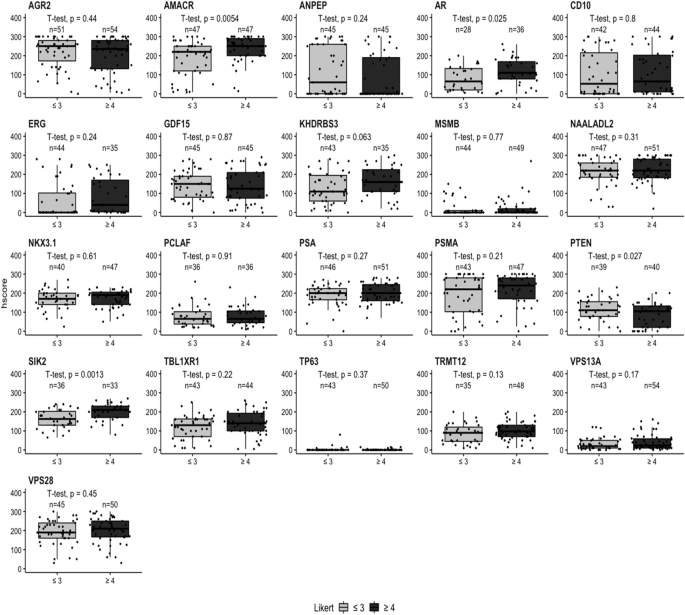
Boxplots comparing the IHC h-scores with MRI Likert grade in malignant tissue for each biomarker. The radiological comparison is split into two groups: Likert ≤ 3 (‘lower’ or ‘equivocal’ likelihood) and Likert ≥ 4 (‘higher’ likelihood). Likert groups are plotted on x-axis (light grey = Likert ≤ 3 and dark grey = Likert ≥ 4) while h-score is plotted on y-axis. Number of patients per group is plotted above each category. Biomarker name above each boxplot graph. Student’s t-test was performed with p value displayed above each boxplot.
The h-score data from patient-matched benign/tumour cores was also analysed by individual Likert group with AMACR and SIK2 showing significant differences of p values of 0.04 and 0.016, respectively in a malignant tissue; while in the benign tissue VPS13A (p = 0.028), ANPEP (p = 0.047) and SIK2 (p = 0.041) were significantly different among individual Likert groups (Supplementary Figs. 4 and 5). There were no significant changes between malignant and adjacent benign tissue for the remaining biomarkers (Supplementary Figs. 4 and 5).
Further to this, we also looked at the individual biomarker’s expression between clinically insignificant and clinically significant PCa based on the biopsy grading groups, GG1 and GG2 (clinically insignificant), and ≥GG3 (clinically significant), which was reported in other study [15]. This was performed on matched tumour biopsies only (Supplementary Fig. 6).
The results showed a significant correlation in NKX3.1 (p = 0.022 for GG1 vs GG2, and p = 0.035 for GG1 vs ≥GG3), TBL1XR1 (p = 0.0037 for GG1 vs ≥GG3) and VPS13A (p = 0.039 for GG1 vs GG2 and p = 0.007 for GG1 vs ≥GG3). Additionally, we looked at how the biopsy grading groups correlated in lower and higher Likert groups. For this reason, we grouped ≤Likert 3 and ≥Likert 4 and compared it with biopsy groups, GG1, GG2 and ≥GG3. This was based on the h-score in the matched tumour biopsies. Only SIK2 showed a significant correlation between Likert scores and GG2 group (p = 0.0029); however, no correlation for the remain groups. A marginal statistical significance was observed in KHDRBS3 and PTEN for Likert scores in GG2 group with p = 0.059 and p = 0.056, respectively. In abovementioned markers the expression difference was present in the group GG2 when comparing with lower and higher Likert score (Likert ≤3 and ≥4). Unfortunately, due to the small number of observations specifically in ≥GG3 group for most of the markers, the analysis was not successful. Therefore, no statistical significance was observed (Supplementary Fig. 7).
Level of serum PSA in suspected PCa patients and the distribution of biomarker h-scores
For the analysis serum PSA was divided into three categories: <10 ng/mL, 10–15 ng/mL and >15 ng/mL and h-score data compared in both matched benign and tumour tissue for each patient. In malignant tissue, CD10 and PCLAF h-scores altered significantly with serum PSA (p = 0.0011 and 0.04 respectively, Supplementary Fig. 8). In the matched benign data, only tissue PSMA was significantly different (p = 0.00046) (Supplementary Fig. 9). The remaining biomarkers showed no significant difference between serum PSA level and biomarker expression in either malignant and matched benign tissue.
Changes in biomarker expression in comparison to different age groups
As age is associated with an increased risk of PCa and poor prognosis we assessed how biomarker expression altered with age [16, 17]. Patients' age was stratified into three groups: <60, 60–70 and >70 and compared to biomarker h-score. Among the 21 markers, only GDF15 was significantly associated with age, using a Kruskal-Wallis rank sum test, in both malignant and matched benign tissue (p values 0.034 and 0.031, respectively, Supplementary Figs. 10 and 11).
Changes in biomarker expression in patients with familial prostate cancer
We assessed if biomarker protein expression correlated with a reported family history of cancer [16, 17] but there was no statistical difference between groups of patients with or without family history for all biomarkers in the malignant tissue (Supplementary Fig. 12). However, GDF15 and SIK2 expression showed an increase in the adjacent benign tissue of men with a positive family history in comparison to patients with no family history, with p values of 0.0025 and 0.022, respectively (Supplementary Fig. 13).
Discussion
The major advantage of this study lies in the comprehensive availability of the image mpMRI data with a representative core for the most aggressive cancer based on the template biopsy and also the clinicopathological variabilities (pathological assessment, level of serum PSA, age, ethnicity and familial PCa) of each patient. Consequently, the objective of this investigation was to identify biomarkers that demonstrate a diagnostic utility in both malignant and the surrounding adjacent benign tissues in relation to the imaging data. We performed IHC to look at the staining intensities of the markers in prostatic biopsies and linked it with the available clinical data. Our results confirmed the literature findings for almost all of the protein markers, where the staining was either over- or under-intensified in the benign and malignant tissues (Figs. 1, 2 and Supplementary Fig. 1). Two of the biomarkers with no changes between benign and malignant samples were NKX3.1 and TBL1XR1. This could be due to the antibodies used in the study or the biological variability and the heterogenous expression level of these proteins.
We compared results across various clinicopathological data (due to the limited number of data points, the analysis for ethnicity groups was omitted) in both types of tissue (Fig. 5). Examining the marker’s expression in adjacent benign samples is important as it can provide essential information about the tumour microenvironment, supporting diagnosis, prognosis and in better treatment options. Alterations in the morphology and microenvironment of neighbouring benign sample may suggest a presence of tumour-promoting agents that facilitate growth, invasion and metastasis of malignant cells [18, 19].

Table shows summary of the results that tested 21 tissue biomarkers on prostatic malignant and matched, neighboburing benign tissues across different clinical data: benign versus tumour tissue, Gleason grade, Likert score, serum PSA, age and family history. Boxes in blue colour show no significant results, boxes in green show p < 0.0001, boxes in pink p < 0.01 and boxes in yellow p < 0.05. Likert score is based on the two-group classification (Fig. 4).
By examining the results of pathological evaluations and mpMRI Likert scores, we have identified two biomarkers, AMACR and PTEN, that share both diagnostic and prognostic value in PCa with AMACR being already used in clinical settings. Both biomarkers are associated with aggressive form of PCa and biochemical recurrence. Furthermore, their expression levels correlate with a higher Gleason grade and stage of the disease [20,21,22].
The majority of the biomarkers tested did not correlate with mpMRI Likert scores. However, CD10, KHDRBS3, PCLAF, PSMA, SIK2 and GDF15 were differentially expressed with PCa progression, emphasising their roles in promoting tumour growth, invasion and metastasis [22,23,24,25,26,27,28]. The upregulation of these biomarkers has been associated with poor prognosis and a more aggressive form of cancer suggesting a potentially important role in the disease [22,23,24,25,26,27,28].
Apart from the pathological Gleason assessment and mpMRI data, we investigated the biopsy GG system, comparing clinically insignificant (GG1 = Gleason 3 + 3 and GG2 = Gleason 3 + 4) and clinically significant (≥GG3 = ≥ Gleason score 4 + 3) PCa with Likert score. A notable finding emerged, revealing SIK2 as a biomarker showing statistical significance between Likert ≤ 3 and Likert ≥ 4 in biopsy grade group 2.
SIK2 is involved in regulating lipid metabolism and synthesis and is associated with cell survival and cell cycle regulation which is also enriched in high Gleason tumours [29]. The marker is upregulated and linked to a more aggressive disease phenotype.
While SIK2 has been implicated in metabolic pathways, its specific association with imaging in PCa remains less understood. Given its involvement in metabolic pathways and potential roles in cancer progression, SIK2 expression may indirectly influence tissue characteristics, aiding in risk stratification, treatment selection and prognosis assessment, thus positioning SIK2 as a promising prognostic marker and drug target.
Additionally, a marginal correlation was also observed in PTEN and KHDRBS3 markers in biopsy grade group 2 when comparing to Likert score, with their association to more aggressive tumours discussed earlier.
While limited data are available on the correlation between malignant tissue and its matched neighbouring benign tissue, some studies have shown that an elevated level of GDF15 in tumour tissue, compared to adjacent benign regions, has been found to increase the risk of PCa recurrence. This was also concomitant with higher Gleason grade [28, 30]. Interestingly, another study found elevated GDF15 in both pathologies, with slightly higher expression levels in adjacent benign regions [31]. These findings highlight the complexity of the tumour microenvironment and the need for further research to fully comprehend their role in cancer progression and modulating the tumour microenvironment.
Tissue markers in combination with mpMRI are a powerful tool in characterisation of clinically significant and potentially aggressive PCa. The incorporation of these biomarkers into diagnostic and prognostic tools can enhance the accuracy of PCa detection and prediction of disease outcomes. The biomarkers associated with poor prognosis and more aggressive forms of PCa can guide the development of targeted therapies and help management of the disease. However, better understanding the mechanisms of action is needed to maximise any therapeutic opportunities. The results presented here unveil tissue biomarkers that correlate with image data. However, further validation in imaging cohorts is required to ensure reproducibility. Given the changing face of PCa diagnosis and the routine incorporation of imaging within the diagnostic pathway, these results highlight the importance of using clinically relevant cohorts in biomarker validation studies at the earliest opportunity.
Data availability
Correspondence and requests for materials and data generated in this study should be addressed to USF.
References
Uhr A, Glick L, Gomella G. An overview of biomarkers in the diagnosis and management of prostate cancer. Can J Urol. 2020;27:24–7.
Tran PT, Hales RK, Zeng J, Aziz K, Salih T, Gajula RP, et al. Tissue biomarkers for prostate cancer radiation therapy. Curr Mol Med. 2012;122:772–87.
Merriel SWD, Funston G, Hamilton W. Prostate cancer in primary care. Adv Ther. 2018;35:1285–94.
Drost F-JH, Osses DF, Nieboer D, Steyerberg EW, Bangma CH, Roobol MJ, et al. Prostate MRI, with or without MRI-targeted biopsy, and systematic biopsy for detecting prostate cancer. Cochrane Database Syst Rev. 2019;4:CD012663.
Nguyen JK, Magi-Galluzzi C. Unfavorable pathology, tissue biomarkers and genomic tests with clinical implications in prostate cancer management. Adv Anat Pathol. 2018;25:293–303.
Saini S. PSA and beyond: alternative prostate cancer biomarkers. Cell Oncol. 2016;39:97–106.
Freedland SJ, Gerber L, Reid J, Welbourn W, Tikishvili E, Park J, et al. Prognostic utility of cell cycle progression score in men with prostate cancer after primary external beam radiation therapy. Int J Radiat Oncol Biol Phys. 2013;86:848–53.
Lobo JM, Trifiletti DM, Sturz VN, Dicker AP, Buerki C, Davicioni E, et al. Cost-effectiveness of the decipher genomic classifier to guide individualized decisions for early radiation therapy after prostatectomy for prostate cancer. Clin Genitourin Cancer. 2017;15:e299–309.
Shore ND, Kella N, Moran B, Boczko J, Bianco FJ, Crawford ED, et al. Impact of the cell cycle progression test on physician and patient treatment selection for localized prostate cancer. J Urol. 2016;195:612–8.
Health Quality Ontario. Prolaris cell cycle progression test for localized prostate cancer: a health technology assessment. Ont Health Technol Assess Ser. 2017;17:1–75.
Olivier J, Stavrinides V, Kay J, Freeman A, Pye H, Ahmed Z, et al. Immunohistochemical biomarker validation in highly selective needle biopsy microarrays derived from mpMRI-characterized prostates. Prostate. 2018;78:1229–37.
Simmons LAM, Kanthabalan A, Arya M, Briggs T, Barratt D, Charman SC, et al. The PICTURE study: diagnostic accuracy of multiparametric MRI in men requiring a repeat prostate biopsy. Br J Cancer. 2017;116:1159–65.
McCarty KS Jr, Miller LS, Cox EB, Konrath J, McCarty KS Sr. Estrogen receptor analyses. Correlation of biochemical and immunohistochemical methods using monoclonal antireceptor antibodies. Arch Pathol Lab Med. 1985;109:716–21.
Parris TZ, Aziz L, Kovács A, Hajizadeh S, Nemes S, Semaan M, et al. Clinical relevance of breast cancer-related genes as potential biomarkers for oral squamous cell carcinoma. BMC Cancer. 2014;14:324.
Mori KM, Sharma V, Comperat EM, Sato S, Laukhtina E, Schuettfort VM, et al. Prognostic impact of different Gleason patterns on biopsy within grade group 4 prostate cancer. Ann Surg Oncol. 2021;28:9179–87.
Daniyal M, Siddiqui ZA, Akram M, Asif HM, Sultana S, Khan A. Epidemiology, etiology, diagnosis and treatment of prostate cancer. Asian Pac J Cancer Prev. 2014;15:9575–8.
Grozescu T, Popa F. Prostate cancer between prognosis and adequate/proper therapy. J Med Life. 2017;10:5–12.
Quail D, Joyce J. Microenvironmental regulation of tumor progression and metastasis. Nat Med. 2013;19:1423–37.
Sfanos KS, Yegnasubramanian S, Nelson WG, De Marzo AM. The inflammatory microenvironment and microbiome in prostate cancer development. Nat Rev Urol. 2018;15:11–24.
Lotan TL, Wei W, Morais CL, Hawley ST, Fazli L, Hurtado-Coll A, et al. PTEN loss as determined by clinical-grade immunohistochemistry assay is associated with worse recurrence-free survival in prostate cancer. Eur Urol Focus. 2016;2:180–8.
Esfahani M, Ataei N, Panjehpour M. Biomarkers for evaluation of prostate cancer prognosis. Asian Pac J Cancer Prev. 2015;16:2601–11.
Gülhan Ö, Mahi B. The role of AMACR, CD10, TMPRSS2-ERG, and p27 protein expression among different Gleason grades of prostatic adenocarcinoma on needle biopsy. Clin Med Insights Oncol. 2020;14:1–8.
Singh L, Marwah N, Bhutani N, Pawar D, Kapil R, Sen R. Study the expression of CD10 in prostate carcinoma and its correlation with various clinicopathological parameters. Iran J Pathol. 2019;14:135–41.
Ukai S, Sakamoto N, Taniyama D, Harada K, Honma R, Maruyama R, et al. KHDRBS3 promotes multi-drug resistance and anchorage-independent growth in colorectal cancer. Cancer Sci. 2021;112:1196–208.
Liu X, Cheng C, Cai Y, Gu Y, Wu Y, Chen K, et al. Pan-cancer analyses reveal the regulation and clinical outcome association of PCLAF in human tumors. Int J Oncol. 2022;60:66.
Debnath S, Zhou N, McLaughlin M, Rice S, Pillai AK, Hao G, et al. PSMA-targeting imaging and theranostic agents—current status and future perspective. Int J Mol Sci. 2022;23:1158.
Shi X, Yu X, Wang J, Bian S, Li Q, Fu F, et al. SIK2 promotes ovarian cancer cell motility and metastasis by phosphorylating MYLK. Mol Oncol. 2022;16:2558–74.
Bonaterra GA, Schleper A, Skowronek M, Kilian LS, Rink T, Schwarzbach H, et al. Increased density of growth differentiation factor-15+ immunoreactive M1/M2 macrophages in prostate cancer of different Gleason scores compared with benign prostate hyperplasia. Cancers. 2022;14:4591.
Bon H, Wadhwa K, Schreiner A, Osborne M, Carroll T, Ramos-Montoya A, et al. Salt-inducible kinase 2 regulates mitotic progression and transcription in prostate cancer. Mol Cancer Res. 2015;13:620–35.
Patrikainen L, Porvari K, Kurkela R, Hirvikoski P, Soini Y, Vihko P. Expression profiling of PC-3 cell line variants and comparison of MIC-1 transcript levels in benign and malignant prostate. Eur J Clin Invest. 2007;37:126–33.
Jones AC, Antillon KS, Jenkins SM, Janos SN, Overton HN, Shoshan DS, et al. Prostate field cancerization: deregulated expression of macrophage inhibitory cytokine 1 (MIC-1) and platelet derived growth factor A (PDGF-A) in tumor adjacent tissue. PLoS ONE. 2015;10:e0119314.
Zhang Y, Forootan SS, Liu D, Barraclough R, Foster CS, Rudland PS, et al. Increased expression of anterior gradient-2 is significantly associated with poor survival of prostate cancer patients. Prostate Cancer Prostatic Dis. 2007;10:293–300.
Brychtova V, Vojtesek B, Hrstka R. Anterior gradient 2: a novel player in tumor cell biology. Can Lett. 2011;304:1–7.
Bu H, Bormann S, Schäfer G, Horninger W, Massoner P, Neeb A, et al. The anterior gradient 2 (AGR2) gene is overexpressed in prostate cancer and may be useful as a urine sediment marker for prostate cancer detection. Prostate. 2011;71:575–87.
Vitello EA, Quek S, Kincaid H, Fuchs T, Crichton DJ, Troisch P, et al. Cancer-secreted AGR2 induces programmed cell death in normal cells. Oncotarget. 2016;7:49425–34.
Kuefer R, Varambally S, Zhou M, Lucas PC, Loeffler M, Wolter H, et al. α-Methylacyl-CoA racemase: expression levels of this novel cancer biomarker depend on tumor differentiation. Am J Pathol. 2002;161:841–8.
Zhou M, Chinnaiyan AM, Kleer CG, Lucas PC, Rubin MA. Alpha-Methylacyl-CoA Racemase: a novel tumor marker over-expressed in several human cancers and their precursor lesions. Am J Surg Pathol. 2002;26:926–31.
Alinezhad S, Väänänen RM, Tallgrén T, Perez IM, Jambor I, Aronen H, et al. Stratification of aggressive prostate cancer from indolent disease-prospective controlled trial utilizing expression of 11 genes in apparently benign tissue. Urol Oncol. 2016;34:255.e15–22.
Kong G, Lee H, Tran Q, Kim C, Gong N, Park J, et al. Current knowledge on the function of α-Methylacyl-CoA Racemase in human diseases. Front Mol Biosci. 2020;7:153.
Liu Z, Yang Z, Xiong L, Li D, Zou Q, Yuan Y. ACO2 and ANPEP as novel prognostic markers for gallbladder squamous cell/adenosquamous carcinomas and adenocarcinomas. Int J Clin Oncol. 2020;25:1346–55.
Sørensen K, Abildgaard M, Haldrup C, Ulhøi BP, Kristensen H, Strand S, et al. Prognostic significance of aberrantly silenced ANPEP expression in prostate cancer. Br J Cancer. 2013;108:420–8.
Schreiber CL, Smith BD. Molecular imaging of aminopeptidase N in cancer and angiogenesis. Contrast Media Mol Imaging. 2018;2018:5315172.
Xie B, Li Y, Zhao R, Xu Y, Wu Y, Wang J, et al. Identification of Key Genes and miRNAs in osteosarcoma patients with chemoresistance by bioinformatics analysis. BioMed Res Int. 2018;2018:4761064.
Zhang B, Du T, Zang M, Chang Q, Fan Z, Li J, et al. Androgen receptor promotes gastric cancer cell migration and invasion via AKT-phosphorylation dependent upregulation of matrix metalloproteinase 9. Oncotarget. 2014;5:10584–95.
Sukocheva OA, Li B, Due SL, Hussey DJ, Watson DI. Androgens and esophageal cancer: what do we know? World J Gastroenterol. 2015;21:6146–56.
Lamb CA, Vanzulli SI, Lanari C. Hormone receptors in breast cancer: more than estrogen receptors. Medicina. 2019;79:540–5.
Mishra D, Singh S, Narayan G. Role of B cell development marker CD10 in cancer progression and prognosis. Mol Biol Int. 2016;2016:4328697.
Abdou AG. CD10 expression in tumour and stromal cells of bladder carcinoma: association with bilharziasis. APMIS. 2007;115:1206–18.
Eineluoto JT, Sandeman K, Pohjonen J, Sopyllo K, Nordling S, Stürenberg C, et al. Associations of PTEN and ERG with magnetic resonance imaging visibility and assessment of non-organ-confined pathology and biochemical recurrence after radical prostatectomy. Eur Urol Focus. 2021;7:1316–23.
Adamo P, Ladomery M. The oncogene ERG: a key factor in prostate cancer. Oncogene. 2016;35:403–14.
Erickson AM, Lokman U, Lahdensuo K, Tornberg S, Visapaa H, Bergroth R, et al. PTEN and ERG expression in MRI-ultrasound guided fusion biopsy correlated with radical prostatectomy findings in men with prostate cancer. Prostate. 2020;80:1118–27.
Fujita K, Nonomura N. Urinary biomarkers of prostate cancer. Int J Urol. 2018;25:770–9.
Li P, You S, Nguyen C, Wang Y, Kim J, Sirohi D, et al. Genes involved in prostate cancer progression determine MRI visibility. Theranostics. 2018;8:1752–65.
Sadasivan SM, Chen Y, Gupta NS, Han X, Bobbitt KR, Chitale DA, et al. The interplay of growth differentiation factor 15 (GDF15) expression and M2 macrophages during prostate carcinogenesis. Carcinogenesis. 2020;8:1074–82.
Wang J, Li W, Wang Y, Li C, Ding M, Zhang H, et al. The H6D genetic variation of GDF15 is associated with genesis, progress and prognosis in colorectal cancer. Pathol Res Pract. 2015;11:845–50.
Luxton HJ, Simpson BS, Mills IG, Brindle NR, Ahmed Z, Stavrinides V, et al. The oncogene metadherin interacts with the known splicing proteins YTHDC1, Sam68 and T-STAR and plays a novel role in alternative mRNA splicing. Cancers. 2019;11:1233.
Zhang L, Guo L, Peng Y, Chen B. Expression of T-STAR gene is associated with regulation of telomerase activity in human colon cancer cell line HCT-116. World J Gastroenterol. 2006;122:4056–60.
Ren S, Peng Z, Mao JH, Yu Y, Yin C, Gao X, et al. RNA-seq analysis of prostate cancer in the Chinese population identifies recurrent gene fusions, cancer-associated long noncoding RNAs and aberrant alternative splicings. Cell Res. 2012;22:806–21.
Whitaker HC, Warren AY, Eeles R, Kote-Jarai Z, Neal DE. The potential value of microseminoprotein-beta as a prostate cancer biomarker and therapeutic target. Prostate. 2010;70:333–40.
Hosokawa M, Takehara A, Matsuda K, Eguchi H, Ohigashi H, Ishikawa O, et al. Oncogenic role of KIAA0101 interacting with proliferating cell nuclear antigen in pancreatic cancer. Cancer Res. 2007;67:2568–76.
Cao H, Zheng J, Yao Y, Yang Q, Yan R, Sun W, et al. Overexpression of KIAA0101 promotes the progression of non-small cell lung cancer. J Cancer. 2020;11:6663–74.
Wang X, Hickey RJ, Malkas LH, Koch MO, Li L, Zhang S, et al. Elevated expression of cancer-associated proliferating cell nuclear antigen in high-grade prostatic intraepithelial neoplasia and prostate cancer. Prostate. 2011;71:748–54.
Shaw GL, Whitaker H, Corcoran M, Dunning MJ, Luxton H, Kay J, et al. The early effects of rapid androgen deprivation on human prostate cancer. Eur Urol. 2016;2:214–8.
Simpson BS, Camacho N, Luxton HJ, Pye H, Finn R, Heavey S, et al. Genetic alterations in the 3q26.31-32 locus confer an aggressive prostate cancer phenotype. Commun Biol. 2020;3:440.
Whitaker HC, Shiong LL, Kay JD, Grönberg H, Warren AY, Seipel A, et al. N-acetyl-L-aspartyl-L-glutamate peptidase-like 2 is overexpressed in cancer and promotes a pro-migratory and pro-metastatic phenotype. Oncogene. 2014;3:5274–87.
Jin H, Jung S, DebRoy AR, Davuluri RV. Identification and validation of regulatory SNPs that modulate transcription factor chromatin binding and gene expression in prostate cancer. Oncotarget. 2016;7:54616–26.
Bowen C, Ostrowski MC, Leone G, Gelmann EP. Loss of PTEN accelerates NKX3.1 degradation to promote prostate cancer progression. Cancer Res. 2019;79:4124–34.
Qian D, Zheng W, Chen C, Jing G, Huang J. Roles of CCNB2 and NKX3.1 in nasopharyngeal carcinoma. Cancer Biother Radiopharm. 2020;35:208–13.
Asch-Kendrick RJ, Samols MA, Lilo MT, Subhawong AP, Sharma R, Illei PB, et al. NKX3.1 is expressed in ER-positive and AR-positive primary breast carcinomas. J Clin Pathol. 2014;67:768–71.
Mardanian F, Heidari N. Diagnostic value of prostate-specific antigen in women with polycystic ovary syndrome. J Res Med Sci. 2011;16:999–1005.
Hanamura T, Ohno K, Hokibara S, Murasawa H, Nakamura T, Watanabe H, et al. Clinical significance of serum PSA in breast cancer patients. BMC Cancer. 2019;19:1021.
Maurer T, Eiber M, Schwaiger M, Gschwend JE. Current use of PSMA-PET in prostate cancer management. Nat Rev Urol. 2016;3:226–35.
Schmidt LH, Heitkötter B, Schulze AB, Schliemann C, Steinestel K, Trautmann M, et al. Prostate specific membrane antigen (PSMA) expression in non-small cell lung cancer. PLoS ONE. 2017;12:e0186280.
Baumgartner E, Del Carmen Rodriguez Pena M, Eich ML, Porter KK, Nix JW, Rais-Bahrami S, et al. PTEN and ERG detection in multiparametric magnetic resonance imaging/ultrasound fusion targeted prostate biopsy compared to systematic biopsy. Hum Pathol. 2019;90:20–26.
Switlyk MD, Salberg UB, Geier OM, Vlatkovic L, Lilleby W, Lyng H, et al. PTEN expression in prostate cancer: relationship with clinicopathologic features and multiparametric MRI findings. AJR. Am J Roentgenol. 2019;212:1206–14.
Alvarez-Garcia V, Tawil Y, Wise HM, Leslie NR. Mechanisms of PTEN loss in cancer: it’s all about diversity. Semin Cancer Biol. 2019;59:66–79.
Que WC, Qiu HQ, Cheng Y, Liu MB, Wu CY. PTEN in kidney cancer: a review and meta-analysis. Clin Chim Acta. 2018;480:92–98.
Gao T, Zhang X, Zhao J, Zhou F, Wang Y, Zhao Z, et al. SIK2 promotes reprogramming of glucose metabolism through PI3K/AKT/HIF-1a pathway and Drp1-mediated mitochondrial fission in ovarian cancer. Cancer Lett. 2020;469:89–101.
Li JY, Daniels G, Wang J, Zhang X. TBL1XR1 in physiological and pathological states. Am J Clin Exp Urol. 2015;3:13–23.
Daniels G, Li Y, Gellert LL, Zhou A, Melamed J, Wu X, et al. TBLR1 as an androgen receptor (AR) coactivator selectively activates AR target genes to inhibit prostate cancer growth. Endocr Relat Cancer. 2014;21:127–42.
Smirnov A, Anemona L, Novelli F, Piro CM, Annicchiarico-Petruzzelli M, Melino G, et al. p63 is a promising marker in the diagnosis of unusual skin cancer. Int J Mol Sci. 2019;20:5781.
Gatti V, Bongriorno-Borbone L, Fierro C, Annicchiarico-Petruzzelli M, Melino G, Peschiaroli A. P63 at the crossroads between stemness and metastasis in breast cancer. Int J Mol Sci. 2019;20:2683.
Wang K, Zheng M, Ren Y. Overexpression of TRMT12 may independently predict poor overall survival in patients with head and neck squamous cell carcinoma. OncoTargets Ther. 2019;12:7269–79.
Rodriguez V, Chen Y, Elkahloun A, Dutra A, Pak E, Chandrasekharappa S. Chromosome 8 BAC array comparative genomic hybridization and expression analysis identify amplification and overexpression of TRMT12 in breast cancer. Genes Chromosomes Cancer. 2007;46:694–707.
Velayos-Baeza A, Vettori A, Copley RR, Dobson-Stone C, Monaco AP. Analysis of the human VPS13 gene family. Genomics. 2004;3:536–49.
An CH, Kim YR, Kim HS, Kim SS, Yoo NJ, Lee SH. Frameshift mutations of vacuolar protein sorting genes in gastric and colorectal cancers with microsatellites instability. Hum Pathol. 2012;1:40–47.
Honisch S, Yu W, Liu G, Alesutan I, Towhid ST, Tsapara A, et al. Chorein addiction in VPS13A overexpressing rhabdomyosarcoma cells. Oncotarget. 2015;6:10309–19.
Shi W, Hu D, Lin S, Zhuo R. Five-mRNA signature for the prognosis of breast cancer based on the ceRNA network. Biomed Res Int. 2020;2020:9081852.
Borlak J, Langer F, Chatterji B. Serum proteome mapping of EGF transgenic mice reveal mechanistic biomarkers of lung cancer precursor lesions with clinical significance for human adenocarcinomas. Biochim Biophys Acta Mol Basis Dis. 2018;10:3122–44.
Wagenaar TR, Tolstykh T, Shi C, Jiang L, Zhang J, Li Z, et al. Identification of the endosomal sorting complex required for transport-I (ESCRT-I) as an important modulator of anti-miR uptake by cancer cells. Nucleic Acids Res. 2015;2:1204–15.
Hornung T, O’Neill HA, Logie SC, Fowler KM, Duncan JE, Rosenow M, et al. ADAPT identifies an ESCRT complex composition that discriminates VCaP from LNCaP prostate cancer cell exosomes. Nucleic Acids Res. 2020;8:4013–27.
Acknowledgements
The authors would like to acknowledge the support of University College London in completing this study. We would also like to acknowledge Dr. Timothy Stone and Prof. Norman Williams for their support with data analysis. Finally, we are very grateful to the patients who gave their samples for this research.
Funding
We are grateful to Prostate Cancer UK, Prostate Cancer Centre of Excellence and Rosetrees Trust for their support in funding our laboratory work.
Author information
Authors and Affiliations
Contributions
USF, LMCE: data curation; USF, VS, BSS, HQ, LMCE, ZA, MFA, JDK, JO: investigation; USF, VS, BSS, LMCE: methodology; USF, VS, BSS: project administration; USF, VS, BSS, HQ, ZA, MFA, JDK, JO: data and statistical analysis; USF, VS, BSS, HQ, HP, ZA, MFA, JDK, JO, SH, DP, AF, AH, CMM, HUA, HCW: review and edit of the manuscript; USF: study design, formal analysis, supervision, visualisation, original draft; HP: experimental and data handling guidance; SH, DP, AF, AH, CMM, HUA, HCW: project overview; HCW: grant application, project development. All authors read and approved the final paper.
Corresponding author
Ethics declarations
Competing interests
The authors declare no competing interests.
Ethics
Ethics committee approval for the PICTURE study was granted by London City Road and Hampstead National Research Ethics Committee (11/LO/1657) and all procedures were in accordance with the Helsinki Declaration. Informed consent was obtained from all individual participants included in the study.
Additional information
Publisher’s note Springer Nature remains neutral with regard to jurisdictional claims in published maps and institutional affiliations.
Supplementary information
Rights and permissions
Open Access This article is licensed under a Creative Commons Attribution 4.0 International License, which permits use, sharing, adaptation, distribution and reproduction in any medium or format, as long as you give appropriate credit to the original author(s) and the source, provide a link to the Creative Commons licence, and indicate if changes were made. The images or other third party material in this article are included in the article’s Creative Commons licence, unless indicated otherwise in a credit line to the material. If material is not included in the article’s Creative Commons licence and your intended use is not permitted by statutory regulation or exceeds the permitted use, you will need to obtain permission directly from the copyright holder. To view a copy of this licence, visit http://creativecommons.org/licenses/by/4.0/.
About this article

Cite this article
Stopka-Farooqui, U., Stavrinides, V., Simpson, B.S. et al. Combining tissue biomarkers with mpMRI to diagnose clinically significant prostate cancer. Analysis of 21 biomarkers in the PICTURE study. Prostate Cancer Prostatic Dis 28, 457–468 (2025). https://doi.org/10.1038/s41391-024-00920-1
Received:
Revised:
Accepted:
Published:
Issue date:
DOI: https://doi.org/10.1038/s41391-024-00920-1
This article is cited by
-
Computed tomography imaging analysis of hematogenous disseminated pulmonary tuberculosis cases combined with prostate tuberculosis
BMC Medical Imaging (2025)
-
Clarifying the clinical role of biparametric MRI: reflections on diagnostic equivalence and patient-level stratification
Prostate Cancer and Prostatic Diseases (2025)
-
Multi-regional Multiparametric Deep Learning Radiomics for Diagnosis of Clinically Significant Prostate Cancer
Journal of Imaging Informatics in Medicine (2025)
