
Abstract
Remote sensing data could increase the value of tropical forest resources by helping to map economically important species. However, current tools lack precision over large areas, and remain inaccessible to stakeholders. Here, we work with the Protected Areas Authority of Peru to develop and implement precise, landscape-scale, species-level methods to assess the distribution and abundance of economically important arborescent Amazonian palms using field data, visible-spectrum drone imagery and deep learning. We compare the costs and time needed to inventory and develop sustainable fruit harvesting plans in two communities using traditional plot-based and our drone-based methods. Our approach detects individual palms of three species, even when densely clustered (average overall score, 74%), with high accuracy and completeness for Mauritia flexuosa (precision; 99% and recall; 81%). Compared to plot-based methods, our drone-based approach reduces costs per hectare of an inventory of Mauritia flexuosa for a management plan by 99% (USD 5 ha-1 versus USD 411 ha-1), and reduces total operational costs and personnel time to develop a management plan by 23% and 36%, respectively. These findings demonstrate how tailoring technology to the scale and precision required for management, and involvement of stakeholders at all stages, can help expand sustainable management in the tropics.
Introduction
High-resolution UAV data promises to provide cost-effective solutions to a range of conservation challenges in the tropics1. For example, these platforms have been used to enable community-led wildlife monitoring in Borneo2 and delimit priority areas for conservation and restoration in tropical dry forests in Peru3. However, despite their potential, much of the use of UAVs retains a focus on the technology, rather than leading to operational conservation success4. This failure is an example of the research-implementation gap5, which is linked, in broad terms, to insufficient focus on how to link researchers and stakeholders6,7,8.
This issue is particularly notable in the use of UAVs to map and monitor tree species populations in moist forests9,10,11,12. Sustainable use of forest products derived from tropical trees is crucial for addressing the interlinked challenges of biodiversity conservation, supporting livelihoods of local communities and climate change mitigation, and could greatly benefit from the use of cost-effective means of mapping species populations at the scale of entire landscapes. However, there are no cases of the operational use of species-level monitoring by UAVs by stakeholders to support this goal. In contrast, current approaches with high-resolution RS data focus on cases where the phenology or colour of the species are highly distinctive13,14 or where the species only occurs at low densities10, neither of which are focused on management needs. The challenges are two-fold. First, we need to overcome the technical challenge of the issues that stakeholders face where they require these data, and second, we need to ensure that these ‘conservation tools’ are accessible to and adopted by, stakeholders15.
We address these twin challenges in the context of sustainable harvesting16,17 of the fruit of arborescent palms in Amazonia - Mauritia flexuosa, Oenocarpus bataua, and Euterpe precatoria18,19,20 (Fig. 1). These species are vital for supporting local communities, providing food and habitat for wildlife18,21,22,23 and maintaining key ecosystem services23,24,25,26 including in landscapes with exceptional levels of carbon storage - M. flexuosa dominated palm swamps store 5.4 Gigatonnes of carbon, mostly belowground as peat27,28. These species are well-suited to sustainable management as they are among the most abundant tree species in Amazonia (so-called “hyperdominant” species)29 and have a high economic value30: the gross potential value of M. flexuosa fruit harvesting in northern Peru was estimated at USD 41 ± 20.1 million annually16, whilst the global E. precatoria market was valued at USD 796.9 million in 2022 and is expected to grow at an annual growth rate of 11.3% until 203231; the market for oil from O. bataua fruits is also expected to grow by 4% annually until 203132,33. However. these species face anthropogenic threats that diminish both their abundance and regeneration potential17. To address the increasing demand for these resources, management plans that implement non-destructive methods of fruit harvesting, such as climbing, must be developed and implemented25,34.

Images of the three most ecologically and economically important arborescent palm species in the Peruvian Amazon.
Numerous initiatives have been established to promote sustainable fruit harvesting from economically and ecologically important arborescent palms. However, a key challenge for developing effective management plans for these resources is accurately mapping their abundance and distribution. Traditional plot-based fieldwork methods are inefficient, particularly given the vast extent and often waterlogged conditions of these ecosystems35,36,37. High spatial resolution imagery is an attractive potential solution38, yet previous studies that mapped tropical peatlands have a spatial resolution of approximately 30 m, which provides insufficient detail to measure the abundance of palms accurately35,36,39,40. Commercial satellite imagery with sub-50 cm resolution exists, but it is limited by cost and cloud cover, similar to the use of crewed airborne imagery38,41. In contrast, uncrewed aerial vehicles (UAVs) provide a cost-effective, safe option for obtaining very high spatial resolution imagery (approximately 10 cm) at sufficient spatial scale for management purposes (100–1000 ha)38. When combined with deep learning techniques, UAVs allow the use of automated procedures for individual tree species detection9,42,43, as well as palm species detection and quantification10,12. However, an operational method for landscape-scale mapping and quantifying the abundance of palm species in dense tropical forests, where the crowns of the same species often overlap, has not yet been implemented. While such methods hold great potential to expand the use of management plans in these ecosystems, the challenge extends beyond technological proof-of-concept. For these ‘conservation tools’ to be effective at landscape scales, they must be robust, cost-effective, easy to implement, and tailored to the needs of user organisations15. Stakeholder involvement is crucial at every stage of development, and the costs - including capital expenditure, implementation and training - must be comparable or lower than other approaches15.
Here, we therefore not only aimed to automate the detection and quantification of three economically important palm tree species - Mauritia flexuosa, Oenocarpus bataua and Euterpe precatoria - using a combination of field data, red-green-blue (RGB) uncrewed aerial vehicle (UAV) imagery, and deep convolutional neural networks (CNNs) - but also to demonstrate how it provides a cost- and time-effective solution for the Peruvian government’s Protected Areas authority (SERNANP) to manage these forest resources. To achieve this, we collected RGB UAV images and GPS location points from multiple sites where M. flexuosa, E. precatoria, or O. bataua occurred in the region of Loreto in northern Peru (Supplementary Fig. 1). We developed semantic segmentation maps to classify UAV mosaics pixels as one of the three palm species or as background, and then trained a model to partition the semantic segmentation maps into individual palm crowns. We tested the models using UAV mosaics spanning 70–230 hectares from the Madre de Dios region in southern Peru (Fig. 2) to assess the distribution and abundance of the palm species. SERNANP then applied this technology to complete inventories as part of developing two community-led management plans for sustainable palm fruit harvesting. Finally, we compared the costs of inventories and developing management plans using a traditional plot-based versus our drone-based approach.

Distribution of the locations surveyed for (A) training and (B) testing a convolutional neural network (CNN) model for detecting three species of arborescent palms using large-scale UAV mosaics. The brown dots correspond to the sites where the UAV surveys were conducted. The purple line corresponds to the Pastaza-Maranon (PM) Foreland Basin. Sources: Cartographic base layers belong to the National Geographic Institute of Peru – IGN (2017) and to the Ministry of Environment of Peru MINAM (2019). Source data are provided as a Source Data file.
Our work is applicable to other tropical regions, as it offers a model trained across a range of forest conditions for bridging the gap between technological development and practical conservation. By demonstrating how UAV-based tools can be effectively implemented, we provide a pathway for supporting forest management and conservation outcomes globally.
Results and discussion
Landscape-scale palm species mapping
Our approach showed a high-level accuracy for detecting the crowns of Mauritia flexuosa (accuracy of positive predictions: precision 99%; completeness of positive predictions: recall 69% and average overall performance: F1 score of 81%) but lower accuracy for Euterpe precatoria (89% Precision at 50% recall and F1 of 64%) and Oenocarpus bataua (85% Precision at 52% recall and F1 of 65%) as they were not as abundant in the training data as M. flexuosa (Table 1 and Supplementary Table 1). For instance, model 1, which had only 18 training palms for E. precatoria, was unable to detect this species. In contrast, model 6, which had 266 training records for this species, achieved a higher level of accuracy.
The success of this semantic segmentation method is particularly noteworthy given that the UAV mosaics used in Madre de Dios were captured by UAV cameras that were not used for model training, and that the floristic composition varies between regions40,44. This high level of robustness and generalisation can be attributed to the use of a diverse set of training samples and the inclusion of data augmentation techniques. These techniques, which modify existing training images, introduce variations that simulate varying flight conditions, such as changes in flying height, illumination, wind presence, humidity, and different camera settings. By artificially expanding datasets through image augmentation, the likelihood of encountering similar cases in future data is increased. Our study, therefore, supports work showing that combining a diverse dataset with data augmentation is a highly effective technique for enhancing dataset quality and improving model performance45,46.
Landscape-scale palm quantification
Overall, our model accurately quantifies the abundance of arborescent palm species even amidst densely clustered and large populations of palms (Fig. 3 and Supplementary Fig. 2). The approach works particularly well for M. flexuosa (Fig. 3) but could be improved for O. bataua and E. precatoria by including more training data, especially from forest types that were not well represented in this research (e.g., terra firme forests). In general, the performance of the model is highest in areas where more training data was available and where palm crowns were fully visible: difficulties arise when palms are stacked on top of each other, which results in some crown centres not being visible, and hence the palm crowns are not split and the number of individuals is underestimated compared to field data (Fig. 4).

For sites with less than a thousand individuals, the values of palms in the UAV mosaics were based on the count of GPS locations of palms with visible crowns in the canopy at each site. For the sites with a greater number of individuals, the reference values were the total count of manually located crowns in the UAV mosaics. The red lines show the 1:1 relationship in each case. Source data are provided as a Source Data file.

Examples of the final model predictions for the location and crown delineation of three species of palm tree in five habitat types: (a) plantation, (b) swamp forest, (c) terra firme, (d) urban, and (e) pole forest. For each habitat, the average F1 score across species per site in the region of Loreto is also shown. Source data are provided as a Source Data file.
The developed method allows us to detect the centre of arborescent palms, delineate their crowns based on the distance to the centre and the learned shape of the palm, and count the number of individuals in a given area. Our approach shows a high level of generalization across lowland Amazonian regions, but it would still be valuable to evaluate the performance of our model in other Amazonian forests where these arborescent palm species also occur along with varying tree species composition, such as in pre-montane forests or other regions of Amazonia.
In large UAV mosaics, there are some areas with artifacts that can result in misclassifications. This is evident in the case of O. bataua, where false positives are prone to occur when certain artifacts resemble the long leaves of this species. Although the model is able to reduce some misclassifications if the misclassified areas are smaller than the average size of the palm crowns, this issue may lead to an overestimation of the number of individuals. In addition, some palm individuals remain undetected due to crown shape distortion, which occurs particularly when artifacts appear along the borders of mosaics or during the blending of large mosaics. This issue can be mitigated by adhering to best practices during UAV flights particularly avoiding flights during windy conditions47 and during pre-processing. Clipping the edge of the mosaics can also reduce the relief displacement often associated with insufficient overlap between images48. Working with larger UAVs, such as Vertical Take Off and Landing UAVs (VTOLs), could also increase the coverage extent and improve image blending, as they capture more images in a single mission49. Their use and associated cost analysis remain areas for future research.
The high-resolution location data provided by the UAV mosaics enables us to visualise the spatial distribution and ecological associations of the palm species at a fine scale. These data, therefore, provide a foundation for exploring processes, such as environmental filtering, dispersal limitation, gene flux and/or conspecific interactions that may determine the distributions of tropical tree species50,51. For example, M. flexuosa, in our study area, tends to form large clusters in waterlogged areas, closer to water bodies, and O. bataua tends to cluster in swampy patches within terra firme forests25,29,52,53, suggesting that environmental filtering may be important for these species, whereas E. precatoria shows a scattered distribution and forms smaller groups54, which may reflect an important role for dispersal limitation (Fig. 5).
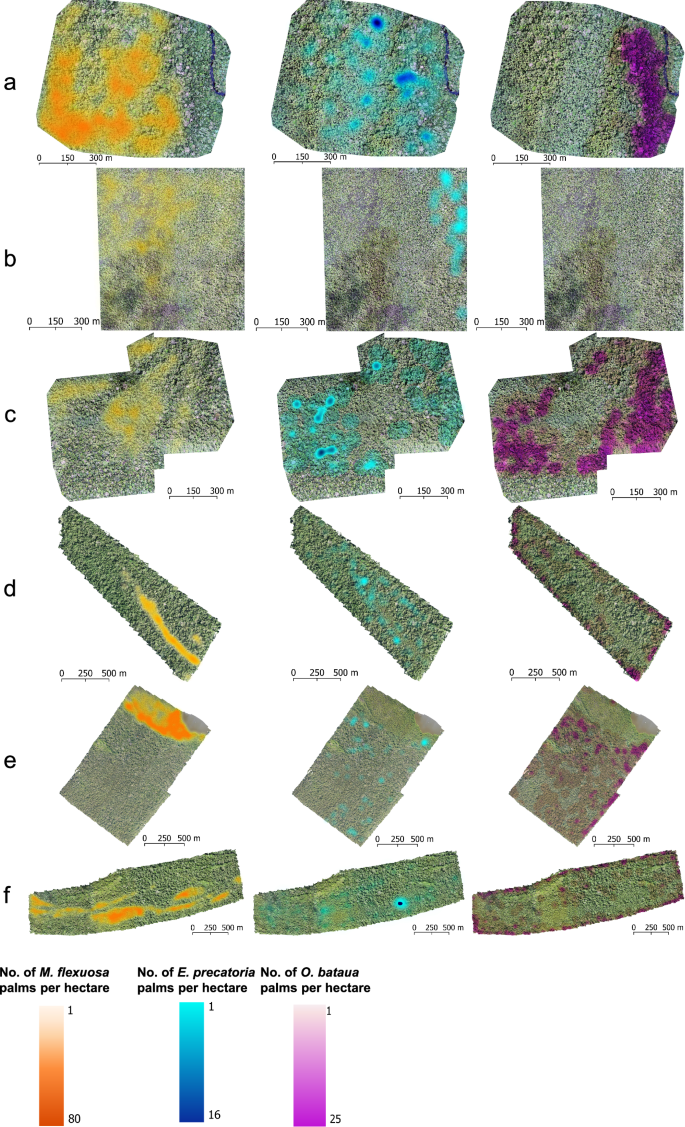
Variation in stem density of three arborescent palm species (Mauritia flexuosa, Euterpe precatoria and Oenocarpus bataua) across six UAV mosaics covering 70 to 230 hectares in Loreto (a–c) and Madre de Dios (d–f). a Parinari community, palm swamp. b Nueva York Community, pole forest with no presence of Oenocarpus. c Piura community, palm swamp. d Sector Briolo – Elina, palm swamp/ terra firme forest. e Around the Sandoval lake, palm swamp/ terra firme forest. f Sector Briolo – Brigida, palm swamp/ terra firme forest.
It is important to note that the predictions of our model are solely based on the top canopy, as the UAV mosaic only captures the upper layer of the forest. Therefore, the model detects sub-canopy and understorey palms to a much lesser extent. However, in natural forests, taller individuals of M. flexuosa - being in the top canopy and receiving higher light incidence - bear more and larger fruits suitable for commercialisation55, with similar trends for E. precatoria56 and O. bataua57. Hence, fruit production is concentrated in mature canopy palms, making this underestimation negligible when using this approach to map this resource to support the development of management plans.
Bridging the research-implementation gap
Our approach to bridging the research-implementation gap with mapping the distribution of these palms, mirrors the framework of Reed et al. (2014)8 and builds on insights from the conservation planning6 and conservation technology literature15.
First, the key stakeholder, the Peruvian Protected Areas Authority (SERNANP), was involved from the proposal stage (i.e., during project ‘design’8) and the research question that we address - mapping palm species in dense stands - is a key question for SERNANP (i.e., the research ‘represents’ stakeholder needs8). For example, in the region of Loreto, only 1.29% of harvested M. flexuosa fruits come from approved management plans (Regional Government of Loreto, 2019), highlighting the need for more effective resource inventory techniques to improve resource management. To date, SERNANP has granted 28 permissions to harvest M. flexuosa in the Loreto region58 and is in the process of issuing these permissions in the Madre de Dios region59, with our technology being used in two of these initial cases.
Second, our research has engaged stakeholders over a long period8 with a strong focus on capacity building and training6. Over the past decade, multiple research projects have brought SERNANP and our research team together, exploring the distribution and carbon stores of these palm swamps27,36, the economic potential of palm fruit harvesting16 and the potential to identify crowns of different palm species60. Our current collaboration has involved significant engagement activities through in-person and online workshops, as well as ad hoc meetings. We began with an initial session to harmonise ideas and identify stakeholder needs (online, April 10, 2019, with 18 participants). This was followed by drone flight training (May 24, 2019, with 7 participants), training on image preprocessing, including mosaicking (January 28, 2020, with 36 participants), and a session for using the model and providing feedback on its performance, primarily through visual assessments (August 2, 2020, with 4 participants). Third, the technology we developed is designed to be user-friendly15 based on open-source software (Palacios, Tagle et al. in prep), making it accessible and easy for stakeholders to use.
Finally, our approach is cost-effective compared to existing methods for resource inventory. Traditionally, SERNANP has used plot-based methods for resource assessments58. To compare the costs of the plot- and drone-based approaches, we used data from SERNANP to analyse the expenses associated with implementing traditional plot-based (over 10 ha) and UAV-based methods (over 200 ha) for generating these inventory data. Our UAV approach is significantly more cost-effective for mapping and quantifying the abundance of M. flexuosa stems, and for producing the information needed to develop management plans for this resource. Our UAV-based method reduces the costs per hectare of a resource inventory of M. flexuosa by 99% compared to plot-based methods (USD 5 ha-1 versus USD 411 ha−1) and reduces the total operational costs of developing a management plan by 23% (Table 2). This reduction in operational costs is linked to reduced reliance on external services (Supplementary Table 2) arising from investment in capacity building. Park rangers now handle tasks that were previously the responsibility of external consultants, such as drone field surveys, data processing, and writing the resource inventory report. Consultants now focus on writing the management plan.
Plot-based methods have much lower capital costs (Table 2), but even when considering the higher initial capital costs associated with the UAV use, such as acquiring a robust workstation, the UAV itself, software licences, and team training for drone operation and image processing, the UAV approach demonstrates a cost advantage once the number of management plans surpasses four (Fig. 6). This cost advantage arises due to its substantially lower marginal costs per additional plan (Fig. 6) and is likely to be achieved as the equipment typically lasts 3–5 years and the trained personnel are often permanent staff who remain long-term.

Source data are provided as a Source Data file.
The UAV approach also offers more than an order of magnitude more spatial coverage, and this greater area not only amplifies the economic benefits of employing drones but also enables cost-effective surveying of locations that would otherwise be excluded. This advantage empowers local communities to expand their harvesting areas without requiring extensive search efforts. Additionally, it reduces the time of personnel involved in these tasks by one-third (Supplementary Table 2).
Our method, therefore, provides a practical, cost-and-time-effective and reliable technique for generating essential information, such as the location of palm crowns and their areas across landscapes of 100-250 hectares. This method can support the effective development of management plans and has the potential to improve the spatial detail and timeliness of forest monitoring, benefiting stakeholders involved in the sustainable management of palm resources. Local communities can use it to locate their resources more efficiently, while NGOs and private companies can use it to validate the responsible use of resources. Governmental oversight agencies, such as SERNANP, can use it to estimate the amount of fruit harvested from a given protected area and investigate cases of unsustainable use. By enabling better-informed decision-making and management practices, our method has the potential to contribute significantly to the sustainable management of palm resources and to the protection of the intact forest landscapes where they occur.
Regarding operational matters, our method saves significant time and effort compared to the time-consuming, labour-intensive, and subjective task of visually interpreting UAV mosaics, especially when the identification of these species requires specialised training12. It can also reduce the time for labelling training data by using semi-automatic crown delineations, in contrast to the manual delineation typically used for this type of work.
In addition, as the model has been trained to identify palms under various lighting conditions, no image editing for lighting conditions are required for the UAV mosaic. As a result, SERNANP tested our method presented here and ultimately quantified palm abundance in two communities within the Tambopata National Reserve. These inventories were then used to support the first management plans for palm fruit harvesting in this National Reserve59. Due to cost efficiency, there is potential to adopt this method for larger conservation efforts in Peru. Currently, SERNANP is in the process of integrating our methodology as a standardised national protocol. To facilitate this upscaling, project pilots will be conducted in all regions of Peru where palms are present. These pilots will gather feedback from various protected areas to ensure the methodology’s effectiveness in diverse landscapes.
Our methodology can also be applied to other regions and species with distinctive crowns, given its robustness, which comes from extensive data collection across a range of forest landscapes and imaging conditions. We also use image augmentation techniques to increase data variability and robustness of the model and openly share our model and code. For example, our approach should be explored for mapping the distribution of Euterpe in the dense stands on the floodplains of eastern Amazonia, or for species that occur at high densities in other tropical peatlands, such as Pandanus spp. in Asia/Oceania or Raphia spp. in the Congo basin. More broadly, our approach demonstrates how the gap between research and implementation can be bridged, and these principles are applicable wherever technology is being designed to address conservation challenges.
Methods
Study area
We developed our models based on UAV and ground reference data from 55 sites across the region of Loreto in northern Peruvian Amazonia. There are a wide variety of forest types in this region, including upland forest with clay-rich and white sand soils, seasonally flooded forests and extensive palm swamps61. Surveys were carried out in collaboration with local communities and the National Service of Protected Areas – SERNANP, in areas that our partners indicated had the presence of either Mauritia flexuosa, Euterpe precatoria or Oenocarpus bataua. The sites focussed on seasonally flooded forests and palm swamps but also included some sites that covered planted palms in local communities, which were incorporated to enhance the generalisation of the model. Our overall approach aimed to encompass areas varying in palm density and floristic composition. Some of the sites are within protected natural areas; other sites are forests managed by local communities (Supplementary Fig. 1). Twenty sites include plots from the Amazon Forest Inventory Network (RAINFOR), which we used to supply part of the palm GPS location data; these plot data are managed using the ForestPlots.net online database62,63.
To test the models, we used four UAV mosaics from the region of Madre de Dios in southern Peruvian Amazonia. Here, the UAV flights were carried out over palm swamps in the Tambopata National Reserve, which is situated in the Tambopata River basin near Puerto Maldonado. The UAV mosaics can be accessed at https://doi.org/10.4121/70a8cec0-dfa7-4963-ba8a-612e738ec0cb.v1. SERNANP works closely together with local communities in this region to develop sustainable commercial activities, such as Brazil nut harvesting44. More recently, in response to the growing demand for palm fruits, there has been an increased focus on harvesting the fruits of M. flexuosa in this reserve44.
Ground reference data collection
For the training and validation data, 5089 individuals of M. flexuosa (4497), E. precatoria (282) and O. bataua (310) palms were identified and georeferenced using a handheld Trimble Geo7X GPS-receiver and the dual-frequency GNSS Trimble Tornado antenna, with an average error of approximately 5 m from 2017 to 2019 across all 55 sites.
UAV missions
For the training and validation data, UAV data were collected concurrently with ground data collection using small commercial multi-rotors (DJI Phantom 4 Pro and DJI Phantom 4 RTK)64 over 55 sites from 2017 to 2019. Some sites were surveyed every year, and others only once during this period.
For the testing data, SERNANP conducted missions using commercial small multi-rotors (DJI Phantom 4 and DJI Mavic 2, the latter possessing slightly different camera characteristics) across three sites from 2019 to 2022, flying over the Sandoval lake twice — in 2019 and in 2021.
To ensure the generalisability of the model against variations in the spatial resolution of the UAV mosaics, the missions were conducted at various flying heights, ranging from 60 to 150 metres above ground level (AGL). It is important to note that the maximum flying height permitted by national legislation is 150 m AGL, which precluded capturing images from higher altitudes (up to 500 m AGL), which could otherwise have been useful60. The forward and side overlap ranged from 80 to 90%, and the camera angle was mostly at the nadir position (90°)64.
Data processing
The data processing involved five stages: pre-processing, training an image semantic segmentation model, training an instance segmentation model (Supplementary Fig. 3), accuracy assessment and model testing, and cost analysis. Pre-processing was conducted using various software platforms, detailed in the following subsection. The remaining stages were conducted entirely in the Python programming language65,66, with specific packages referenced as needed.
Pre-processing: Training and Validation data preparation
The pre-processing consisted of 4 steps: (1) mosaicking, (2) multiresolution superpixel partitioning and labelling, (3) tiling and (4) image augmentation. The UAV images collected on the missions were mosaicked using the software Pix4DMapper. Due to the intricate structure of vegetation, different parameters were tested to obtain mosaics with as few artifacts as possible60. In some cases, the mosaics were generated from a single mission, while in other cases, images from different flights over the same site were combined. Eighty-nine UAV mosaics were obtained in total67.
To reduce the time spent on data labelling, mosaics were then used as input for a multiresolution superpixel partitioning that delineates the crowns60. Each crown was assigned the species label corresponding to the ground reference data (the palm tree locations recorded with the GPS). To ensure the accuracy of the data, shapefile layers containing the ground reference points were overlaid on the RGB mosaic using open-source software Quantum GIS (QGIS). This process was conducted to verify whether the location points aligned with the palm tree crowns in the mosaic. In cases where reference palm trees were misaligned, they were either manually adjusted or excluded from the classification if the corresponding palm tree was not clearly identifiable in the mosaic. Subsequently, the shapefiles containing the delineated crowns with their assigned species labels were rasterised to match the same extent as the UAV mosaics using the Python programming languaje65. This approach saves time in training data preparation, as the conventional practice involves manual delineation, which is time-consuming and costly, especially when verifying a large number of tree crowns requires cross-checking by an experienced visual interpreter68.
The third and fourth steps were also conducted in Python. In the third step, mosaics with the labelled data were sliced into tiles of 512 × 512 pixels, ranging from 4 × 4 m to 30 × 30 m on the ground, depending on the mosaic’s spatial resolution. This size is sufficient to capture at least two palms per tile, as shown in our crown measurements (Supplementary Table 3), following the approach for sample selection by Brodrick et al. (2019)69. The tiles were split into a training set (80%) and a validation set (20%). To test the accuracies and generalization of the model, seven combinations of tiles were used to ensure that the trained model could effectively handle diverse characteristics associated with UAV data collection or geographical locations. These characteristics encompassed factors such as illumination conditions, mosaic spatial resolution, and floristic composition (Table 1). To increase the ability of the model to generalise, some of the tiles were augmented using up to two different augmenters per batch, applied randomly70. Image augmentation artificially expands datasets, increasing the likelihood of encountering similar cases in future data, which improves dataset variability and model performance45,46. The augmenters used were affine image transformations such as flipping (50%), rotating ±20°) and zooming in and out (0.8 to 1.2) to simulate different flying paths and altitudes and colour modifications as the change of brightness (±20%) and saturation (−20% to + 10%) to resemble different illumination conditions adding blur to resemble the presence of humidity/light fog or water droplets, motion blur to simulate different wind conditions, elastic transformations to resemble artifacts in the mosaics, and JPEG compression to simulate different camera sensors.
Species mapping: Image Semantic Segmentation model
We used a deep convolutional neural network (CNN), selecting a semantic segmentation architecture and task formulation, rather than object detection. This decision was based on the feedback from our main stakeholders, who indicated that having delineated crowns was an important asset for them and it has been shown that having crown area information (i.e., dominance) is more effective for forest management68. We selected the DeepLab v3 + architecture, which has as its backbone MobileNet-v2 and atrous spatial pyramid pooling (ASPP), allowing enlarging the field of view of filters to incorporate multiple scales context but maintaining localisation accuracy71. We did not perform instance segmentation simultaneously at this point due to the high computational costs and complexity9,68.
Palm quantification: Instance segmentation model
In tropical forests, the clustering of individual species at close proximity presents a challenge for quantifying species’ abundances. Directly quantifying individuals from semantic segmentation maps is inaccurate due to masks potentially encompassing multiple crowns. Hence, a method is required to split these multi-crown segments without high computational costs or complexity. We used a simple yet powerful convolutional neural network-based method, for instance, segmentation based on semantic segmentation masks called Deep Watershed Transform72, which learns how to identify the centre of the palm trees. This method is inspired by the classical watershed transform algorithm, where the distance to the boundary helps to discriminate crowns72. The model uses the segmented image plus the UAV mosaic as input to detect the instances and delineate “basins”, where each basin corresponds to an individual palm crown.
To ensure accuracy, the removal of small predicted pieces of crowns is conducted by a post-process that first fills small holes to keep the integrity of an instance, filling a maximum of 1000 pixels per instance. Then, the instances are eroded to make the spacing between crowns clearer, using the Scikit morphology binary erosion (enlarging darker regions, thus the spaces between crowns). Next, structural erosion from SciPy is applied to maintain the crown shape, where the kernel sizes depend on the species. Later, the instances smaller than the average UAV measurements of crown size (Supplementary Table 3) are removed and holes are filled after erosion using the Scikit morphology module.
Accuracy assessment and model testing
To evaluate the model’s transferability, we utilised full UAV orthomosaics to assess the accuracy and robustness of the seven models trained on different data subsets, as described on Table 1. Among these models, six were trained using different arrangements of training and test data, while the “Final” model incorporated all the training data from the region of Loreto and was tested using the data from the region of Madre de Dios region (Fig. 2).
The training and test data arrangements were designed to cover data scenarios of increasing complexity. Model 1 involved a dataset from a single location with a similar floristic composition, images captured on similar dates within the same year, and the utilisation of the same UAV. The objective was to establish a baseline for the model’s performance. For training and testing this model, five UAV mosaics from the Veinte de Enero community in Loreto from October 2017 were used.
Models 2 to 4 aimed to test the model’s robustness over time and involved three different combinations of datasets grouped by the year of data collection. These combinations utilised two years of data for training and one year for testing. This approach allowed us to account for variations in illumination conditions, habitat diversity, and spatial resolutions resulting from different flying heights.
Model 5 assessed the model’s robustness across different locations. In this case, the model was trained on data from one hydrological basin around the Allpahuayo-Mishana National Reserve and then tested on data from another basin in the Pacaya Samiria National Reserve.
Model 6 explored the model’s performance when the floristic composition of the forests differed slightly. For this scenario, we used most of the available training data from various areas around the Pastaza-Marañon (PM) Foreland Basin, encompassing different habitat types, illumination conditions, and spatial resolutions. The model was then tested with mosaics from the Nueva Jerusalen site, in the north of the Loreto Region, close to the border with Colombia73.
The general performance of the different models was evaluated with the Precision (user’s accuracy), Recall (producer’s accuracy) and F1 score from the Scikit-learn Package74. For the species mapping assessment, a Point-in-polygon method was used75, comparing the ground data polygon with the predicted points. Given that the prediction points are exclusively generated for the target species, in order to evaluate whether the model is predicting non-palm trees as palm trees (commission error), we manually designated other objects not belonging to the target species, as points in the background class. This was done in areas where the presence of the three palm species was not visually identified, such as the crowns of other trees. The selection of these points mirrored a similar number to those allocated for the target species within each plot. In addition, the overall accuracy and the confusion matrices were also calculated.
The Precision— user’s accuracy (UA) —is the number of correctly classified objects (true positives, tp) in a class divided by the total number of points that were predicted by the model:
The Recall— producer’s accuracy (PA) —is derived by dividing the number of correctly classified objects per class (tp) by the total number of polygons according to the ground reference:
The F1 score is the harmonic mean of recall and precision to provide a comprehensive assessment of a model’s performance and thus expresses the balance between recall and precision:
The F1 score was used to assess overall performance, instead of the overall accuracy, because M. flexuosa was more abundant in most plots compared to other palm species.
The overall accuracy (OA) is the total number of correctly classified pixels (tp), divided by the total number of samples (Nc):
where i is the number of classes.
To evaluate our approach to counting individual trees, the predicted number of individual arborescent palm trees was compared to the visible number of palm trees per UAV mosaic across fifty-five sites (Fig. 3). Subsequently, we calculated the R2, RMSE, and the Normalised RMSE to assess the relationship between the predicted and visible counts. For sites with fewer than a thousand individuals, the visible palm values in the UAV mosaics relied on the count of GPS locations; for sites with a higher number of individuals, the reference values were based on manually located crowns. This approach enabled us to assess the scalability of our method across both smaller, uniform areas and larger, more variable regions.
Cost analysis
We sourced the costs associated with developing management plans to support sustainable palm fruit harvesting of M. flexuosa, based on both plot- and drone-based inventories, from SERNANP. We grouped the costs as external services provided by consultants (staff for the field survey, data processing and reporting), capital costs including capital equipment (small boat, drone, appropriate computer with licenced software) and capacity building (drone pilot licences for the park rangers, training on image processing), recurring costs (field consumables not provided by the consultant team), and SERNANP permanent staff costs (Supplementary Table 2).
Costs were quantified in Peruvian Nuevos Soles and converted to USD using the exchange rate for 202176. The costs were based on actual expenditure corresponding to the Master Plan of the Tambopata National Reserve 2019–202344.
Data availability
The UAV mosaics and their details can be found at 4TU ResearchData [https://doi.org/10.4121/70a8cec0-dfa7-4963-ba8a-612e738ec0cb.v1]67. Source data are provided in this paper.
Code availability
The code for training the model and making predictions is available at Code Ocean [https://doi.org/10.24433/CO.0764353.v1]66. For the model training workflow, open the Jupyter notebook “1.PalmsCNN_Tutorial.” To work only with the predictions, use “2.PalmsCNN_Tutorial_Prediction.”The Google Collab notebook and single Python scripts can be found at GitHub: https://github.com/iiap-gob-pe/PalmsCNN/tree/main.
References
Koh, L. P. & Wich, S. A. Dawn of drone ecology: low‐cost autonomous aerial vehicles for conservation. Trop. Conserv. Sci. 5, 121–132 (2012).
Millner, N., Newport, B., Sandbrook, C. & Simlai, T. Between monitoring and surveillance: geographies of emerging drone technologies in contemporary conservation. Progress in Environmental Geography 1, 17–39 (2024).
Baena, S., Boyd, D. S. & Moat, J. UAVs in pursuit of plant conservation – Real world experiences. Ecol. Inform. 47, 2–9 (2018).
López, J. J. & Mulero-Pázmány, M. Drones for conservation in protected areas: present and future. Drones 3, 10 (2019).
Pfeffer, J. & Sutton, R. I. Knowing “what” to do is not enough: turning knowledge into action. Calif. Manag. Rev. 42, 83–108 (1999).
Knight, A. T. et al. Knowing but not doing: selecting priority conservation areas and the research–implementation gap. Conserv. Biol. 22, 610–617 (2008).
Williams, D. R., Balmford, A. & Wilcove, D. S. The past and future role of conservation science in saving biodiversity. Conserv. Lett. 13, e12720 (2020).
Reed, M. S., Stringer, L. C., Fazey, I., Evely, A. C. & Kruijsen, J. H. J. Five principles for the practice of knowledge exchange in environmental management. J. Environ. Manag. 146, 337–345 (2014).
Braga, G. et al. Tree crown delineation algorithm based on a convolutional neural network. Remote Sens. 12, 1288 (2020).
Ferreira, M. P. et al. Individual tree detection and species classification of Amazonian palms using UAV images and deep learning. Ecol. Manag. 475, 118397 (2020).
Wagner, F. H. et al. Using the U-net convolutional network to map forest types and disturbance in the Atlantic rainforest with very high-resolution images. Remote Sens. Ecol. Conserv. 5, 360–375 (2019).
Arce, L. S. D. et al. Mauritia flexuosa palm trees airborne mapping with deep convolutional neural network. Sci. Rep. 11, 19619 (2021).
Wagner, F. H. The flowering of Atlantic forest Pleroma trees. Sci. Rep. 11, 20437 (2021).
Onishi, M. & Ise, T. Explainable identification and mapping of trees using UAV RGB image and deep learning. Sci. Rep. 11, 903 (2021).
Schulz, A. K. et al. Conservation tools: the next generation of engineering–biology collaborations. J. R. Soc. Interface 20, 20230232 (2023).
Hidalgo Pizango, C. G. et al. Sustainable palm fruit harvesting as a pathway to conserve Amazon peatland forests. Nat. Sustain. 5, 479–487 (2022).
Roucoux, K. H. et al. Threats to intact tropical peatlands and opportunities for their conservation. Conserv. Biol. 31, 1283–1292 (2017).
Lopes, E. et al. Mapping the socio-ecology of Non Timber Forest Products (NTFP) extraction in the Brazilian Amazon: the case of açaí (Euterpe precatoria Mart) in Acre. Landsc. Urban Plan. 188, 110–117 (2019).
Romulo, C. L., Kennedy, C. J., Gilmore, M. P. & Endress, B. A. Sustainable harvest training in a common pool resource setting in the Peruvian Amazon: limitations and opportunities. Trees For. People 7, 100185 (2022).
Manzi, M. & Coomes, O. T. Managing Amazonian palms for community use: a case of aguaje palm (Mauritia flexuosa) in Peru. Ecol. Manag. 257, 510–517 (2009).
Cámara-Leret, R. et al. Ecological community traits and traditional knowledge shape palm ecosystem services in northwestern South America. Ecol. Manag. 334, 28–42 (2014).
Henderson, A. Evolution and Ecology of Palms. (New York Botanical Garden Press, New York, 2002).
Zambrana, N. Y. P. et al. Diversity of palm uses in the western Amazon. Biodivers. Conserv. 16, 2771–2787 (2007).
Damasco, G. et al. Certification of açaí agroforestry increases the conservation potential of the Amazonian tree flora. Agrofor. Syst. 96, 407–416 (2022).
Isaza, C. et al. Demography of Oenocarpus bataua and implications for sustainable harvest of its fruit in western Amazon. Popul. Ecol. 58, 463–476 (2016).
Khan, F. & de Granville, J. J. Palms in Forest Ecosystems of Amazonia (Springer-Verlag, 1992).
Hastie, A. et al. Risks to carbon storage from land-use change revealed by peat thickness maps of Peru. Nat. Geosci. 15, 369–374 (2022).
Bourgeau-Chavez, L. L. et al. Advances in Amazonian peatland discrimination with multi-temporal PALSAR refines estimates of peatland distribution, carbon stocks and deforestation. Front Earth Sci. 9, 676748 (2021).
Ter Steege, H. et al. Hyperdominance in the Amazonian tree flora. Science 342, https://doi.org/10.1126/science.1243092 (2013).
Brokamp, G. et al. Trade in palm products in north-western South America. Bot. Rev. 77, 571–606 (2011).
Polaris Market Research. Acai berry market size, share analysis report, 2023-2032. https://www.polarismarketresearch.com/industry-analysis/acai-berry-market#:~:text=Report%20Summary,11.3%25%20during%20the%20forecast%20period (2022).
Pyhälä, A., Brown, K. & Neil Adger, W. Implications of livelihood dependence on non-timber products in Peruvian Amazonia. Ecosystems 9, 1328–1341 (2006).
Market Research Intellect. Ungurahui oil market size, trends and forecast. https://www.marketresearchintellect.com/product/ungurahui-oil-market-size-and-forecast/ (2023).
Falen Horna, L. Y. & Honorio Coronado, E. N. Evaluación de las técnicas de aprovechamiento de frutos de aguaje (Mauritia flexuosa L.f.) en el distrito de Jenaro Herrera, Loreto, Perú. Folia Amazónica 27, 131–150 (2019).
Lähteenoja, O. & Page, S. High diversity of tropical peatland ecosystem types in the Pastaza-Marañón basin, Peruvian Amazonia. J. Geophys. Res. 116, G02025 (2011).
Draper, F. C. et al. The distribution and amount of carbon in the largest peatland complex in Amazonia. Environ. Res. Lett. 9, 124017 (2014).
Hergoualc’h, K. et al. Major carbon losses from degradation of Mauritia flexuosa peat swamp forests in western Amazonia. Biogeochemistry 167, 327–345 (2024).
Sun, Z. et al. UAVs as remote sensing platforms in plant ecology: review of applications and challenges. J. Plant Ecol. 14, 1003–1023 (2021).
IIAP. Diversidad de Vegetación de La Amazonía Peruana Expresada En Un Mosaico de Imágenes de Satélite. http://www.iiap.org.pe/upload/publicacion/DT012.pdf (Instituto de Investigaciones de la Amazonía Peruana, Iquitos, 2004).
Honorio Coronado, E. N. et al. Intensive field sampling increases the known extent of carbon-rich Amazonian peatland pole forests. Environ. Res. Lett. 16, 074048 (2021).
Rocchini, D. et al. Satellite remote sensing to monitor species diversity: potential and pitfalls. Remote Sens. Ecol. Conserv. 2, 25–36 (2016).
Wagner, F. H. et al. Regional mapping and spatial distribution analysis of canopy palms in an Amazon forest using deep learning and VHR images. Remote Sens. 12, 2225 (2020).
Ferreira, M. P. et al. Accurate mapping of Brazil nut trees (Bertholletia excelsa) in Amazonian forests using WorldView-3 satellite images and convolutional neural networks. Ecol. Inform. 63, 101302 (2021).
SERNANP. Plan Maestro de La Reserva Nacional Tambopata 2019-2023. (República del Perú, Lima, 2019).
Shorten, C. & Khoshgoftaar, T. M. A survey on image data augmentation for deep learning. J. Big Data 6, 60 (2019).
Mikołajczyk, A. & Grochowski, M. Data augmentation for improving deep learning in image classification problem. In Proceeding 2018 International Interdisciplinary PhD Workshop, IIPhDW, 117–122 (2018).
Slade, G., Anderson, K., Graham, H. A. & Cunliffe, A. M. Repeated drone photogrammetry surveys demonstrate that reconstructed canopy heights are sensitive to wind speed but relatively insensitive to illumination conditions. Int. J. Remote Sens. 46, 24–41 (2025).
Whitehead, K. & Hugenholtz, C. H. Remote sensing of the environment with small unmanned aircraft systems (UASs), part 1: a review of progress and challenges. J. Unmanned Veh. Syst. 2, 69–85 (2014).
Kumar, V., Sharma, R., Sharma, S., Chandel, S. & Kumar, S. A review on design methods of vertical take-off and landing UAV aircraft. IOP Conf. Ser. Mater. Sci. Eng. 1116, 012142 (2021).
Condit, R. et al. Spatial patterns in the distribution of tropical tree species. Science 288, 1414–1418 (2000).
Kalyuzhny, M., Lake, J. K., Wright, S. J. & Ostling, A. M. Pervasive within-species spatial repulsion among adult tropical trees. Science 381, 563–568 (2023).
Kahn, F. Palms as key swamp forest resources in Amazonia. Ecol. Manag. 38, 133–142 (1991).
Montufar, R. & Pintaud, J.-C. Variation in species composition, abundance and microhabitat preferences among western Amazonian terra firme palm communities. Bot. J. Linn. Soc. 151, 127–140 (2006).
Isaza, C., Bernal, R., Galeano, G. & Martorell, C. Demography of Euterpe precatoria and Mauritia flexuosa in the Amazon: application of integral projection models for their harvest. Biotropica 49, 653–664 (2017).
Romulo, C. L., Gilmore, M. P., Endress, B. A. & Horn, C. Mauritia flexuosa fruit production increases with increasing palm height in the Peruvian Amazon. Plants People Planet 4, 599–604 (2022).
Minor, D. M. & Kobe, R. K. Fruit production is influenced by tree size and size-asymmetric crowding in a wet tropical forest. Ecol. Evol. 9, 1458–1472 (2019).
Miller, C. Fruit production of the ungurahua palm (Oenocarpus bataua subsp. bataua, Arecaceae) in an indigenous managed reserve. Econ. Bot. 56, 165–176 (2002).
Dirección De Gestión De Las Áreas Naturales Protegidas. Modificación Del Plan Anual De Evaluación Y Fiscalización Ambiental (PLANEFA) 2024. https://www.gob.pe/institucion/sernanp/informes-publicaciones/5529174-modificacion-del-plan-anual-de-evaluacion-y-fiscalizacion-ambiental-planefa-2024 (2024).
SERNANP. Resolución Ministerial 198‑2021‑SERNANP. https://www.gob.pe/institucion/sernanp/normas-legales/2174489-198-2021-sernanp (Servicio Nacional de Áreas Naturales Protegidas, 2021).
Tagle Casapia, X. et al. Identifying and quantifying the abundance of economically important palms in tropical moist forest using UAV imagery. Remote Sens. 12, 9 (2019).
Draper, F. C. et al. Peatland forests are the least diverse tree communities documented in Amazonia, but contribute to high regional beta-diversity. Ecography 41, 1256–1269 (2018).
Lopez-Gonzalez, G., Lewis, S. L., Burkitt, M. & Phillips, O. L. ForestPlots.net: a web application and research tool to manage and analyse tropical forest plot data. J. Veg. Sci. 22, 610–613 (2011).
Lopez-Gonzalez, G. et al. ForestPlots.net database. https://www.forestplots.net/secure/ (2009).
Tagle Casapía, X. et al. Protocolo para sobrevuelos con RPAs Phantom 4 Pro y Phantom 4 RTK. http://repositorio.iiap.gob.pe/bitstream/20.500.12921/610/5/tagle_protocolo_2021.pdf (Instituto de Investigaciones de la Amazonía Peruana, 2021).
Welcome to Python.org. https://www.python.org/ (n.d.).
Tagle, X. et al. Code underlying the publication: Effective integration of drone technology for mapping and managing palm species in the Peruvian Amazon. Code Ocean, https://doi.org/10.24433/CO.0764353.v1 (2025).
Tagle, X. et al. Data underlying the publication: Effective integration of drone technology for mapping and managing palm species in the Peruvian Amazon. 4TU ResearchData, https://doi.org/10.4121/70a8cec0-dfa7-4963-ba8a-612e738ec0cb (2025).
Hao, Z. et al. How does sample labeling and distribution affect the accuracy and efficiency of a deep learning model for individual tree-crown detection and delineation. Remote Sens. 14, 1561 (2022).
Brodrick, P. G., Davies, A. B. & Asner, G. P. Uncovering ecological patterns with convolutional neural networks. Trends Ecol. Evol. 34, 734–745 (2019).
Augmenters.meta — imgaug 0.4.0 documentation. https://imgaug.readthedocs.io/en/latest/source/overview/meta.html (n.d.).
Chen, L.-C., Zhu, Y., Papandreou, G., Schroff, F. & Adam, H. Encoder-decoder with atrous separable convolution for semantic image segmentation. Computer Vision - ECCV 833–851 (2018).
Bai, M. & Urtasun, R. Deep watershed transform for instance segmentation. In Proceeding IEEE Conference Computer Vision Pattern Recognition 2858–2866 (2016).
Pérez-Peña, P. E., Zárate-Gómez, R., Ramos-Rodríguez, M. C. & Mejía Carhuanca, K. (eds.) Biodiversidad En La Cuenca Baja Del Putumayo, Perú (Instituto de Investigaciones de la Amazonía Peruana, Iquitos, 2023).
Buitinck, L. et al. API design for machine learning software: experiences from the scikit-learn project. European Conference on Machine Learning and Principles and Practices of Knowledge Discovery in Databases (2013).
Ye, S., Pontius, R. G. & Rakshit, R. A review of accuracy assessment for object-based image analysis: from per-pixel to per-polygon approaches. ISPRS J. Photogramm. Remote Sens. 141, 137–147 (2018).
Valuta.nl. Valuta omrechnen. https://www.valuta.nl/omrechnen (2021).
Acknowledgements
This study was a collaboration of several institutions: at IIAP (BOSQUES, GESCON and DBIO research programmes worked together), with special thanks to Americo Sanchez for his assistance and use of the HPC Manati. We also thank Recursos Amazónicos Frutales (RAFSAC), Amazónicos por la Amazonía (AMPA), Pacaya Samiria, Allpahuayo Mishana and Tambopata National Reserves managed by the Peruvian Protected Areas Authority (SERNANP) and the many communities that hosted fieldwork as part of this work for their assistance and permission to conduct it. We would like to acknowledge personally Jhon Del Aguila, Julio Irarica, Hugo Vásques, Rider Flores, Marta Reguilon, Julinho Benavides, Carlos Villacorta, Alex Tello and Sandra Teves for their help while conducting fieldwork, Rossana Diaz for helping with fieldwork logistics, to Gabriel Hidalgo and Faustino Vacalla for contributing information related to the use of Mauritia flexuosa and to Esau Echia for contributing with SERNANP related information. We are grateful to the AMAPOLLEN consortium for providing the space for further discussions on future applications on the method, particularly Rommel Montufar for discussions on the variation in the distribution of palm species in Latin America and Agustín Lobos for code improvement recommendations regarding potential future applications of the method. We also thank the funding agencies CONCYTEC (Peru), the Newton Fund (UK) and the Embajada Británica Lima for supporting the project “Novel approaches to understand the state of biodiversity and support livelihoods: the distribution and degradation levels of Mauritia flexuosa stands in Amazonia” (grant agreement 41469429; to T.R.B. and D.d.C.T.) that made most of the fieldwork in Loreto and data processing possible; to the WWF via the Russel E. Train Education for Nature Programme (EFN) for funding X.T (grant agreement #RF67) to write the manuscript as part of her doctoral studies; to the Gordon and Betty Moore Foundation (grant number 5349 to T.R.B.) for “MonANPeru: Monitoring Protected Areas in Peru to Increase Forest Resilience to Climate Change” that allowed the collection of part of the field data in the Loreto Region; to the National Fund for Scientific, Technological Development and Technological Innovation-FONDECYT, for the financing of the project “Hunting animals and native palm trees in food security and in the fight against economic poverty in indigenous communities in the upper basin of the Putumayo River, Peru-Colombia border” for funding P.P.P. (Contract No. 136-2018-FONDECYT-BM-IADT-AV) and to SERNANP for supporting the fieldwork in the Madre de Dios Region as part of the Master Plan of the Tambopata National Reserve 2019–2023. TRB acknowledges financial support from the Natural Environment Research Council (grant NE/T012722/1 – ‘SECO’). D.M. acknowledges the support from the Agence Nationale de la Recherche (ANR) project OBTEA (grant number ANR-22-CPJ1-0054-01).
Author information
Authors and Affiliations
Contributions
X.T.C., F.C.D., D.D.C.T. and T.R.B. conceived the study. X.T.C., D.M., H.B. and M.H. designed the methodology. X.T.C., A.D.D., L.F., S.D.L.P., E.F.G., P.P.P., F.C.D. and G.F.L. collected and processed the ground data; X.T.C., A.D.D., E.F.G, R.C.V., S.P., S.D.L.P. and L.F. processed the UAV data; X.T.C., D.M., H.B., N.E.T., G.M., E.F.G., T.R.B. and M.H. conducted the formal analysis. X.T.C., M.H., E.N.H.C., T.R.B, R.C.V., L.F., S.P. and S.D.L.P. designed the graphics, X.T.C. wrote the manuscript with critical inputs from E.N.H.C., E.F.G., G.C., H.B., D.M., F.C.D., N.E.T., G.F.L., G.M., L.F. and T.R.B. All authors have read and agreed to the published version of the manuscript.
Corresponding author
Ethics declarations
Competing interests
The authors declare no competing interests.
Peer review
Peer review information
Nature Communications thanks Lianzhi Huo, and the other anonymous reviewer(s) for their contribution to the peer review of this work. A peer review file is available.
Additional information
Publisher’s note Springer Nature remains neutral with regard to jurisdictional claims in published maps and institutional affiliations.
Supplementary information
Source data
Rights and permissions
Open Access This article is licensed under a Creative Commons Attribution-NonCommercial-NoDerivatives 4.0 International License, which permits any non-commercial use, sharing, distribution and reproduction in any medium or format, as long as you give appropriate credit to the original author(s) and the source, provide a link to the Creative Commons licence, and indicate if you modified the licensed material. You do not have permission under this licence to share adapted material derived from this article or parts of it. The images or other third party material in this article are included in the article’s Creative Commons licence, unless indicated otherwise in a credit line to the material. If material is not included in the article’s Creative Commons licence and your intended use is not permitted by statutory regulation or exceeds the permitted use, you will need to obtain permission directly from the copyright holder. To view a copy of this licence, visit http://creativecommons.org/licenses/by-nc-nd/4.0/.
About this article

Cite this article
Tagle Casapia, X., Cardenas-Vigo, R., Marcos, D. et al. Effective integration of drone technology for mapping and managing palm species in the Peruvian Amazon. Nat Commun 16, 3764 (2025). https://doi.org/10.1038/s41467-025-58358-5
Received:
Accepted:
Published:
Version of record:
DOI: https://doi.org/10.1038/s41467-025-58358-5
