
Abstract
Reliable cost projection data is critical for energy system modelling, guiding policy and investment decisions that underpin the global energy transition. In this work, we compile and standardise a broad dataset from over 110 existing regional and global studies to provide an organised and spatio-temporally granular dataset of cost projections for major clean energy technologies. The dataset covers Capital Expenditures (CAPEX) and Levelised Costs of Electricity or Hydrogen (LCOE or LCOH) for utility-scale and rooftop photovoltaics, onshore and offshore wind power, grid-scale Li-ion batteries, concentrated solar thermal power, and large-scale alkaline and PEM electrolysers. The data span national, continental, and global scales, with annual granularity through 2050 and metadata for source type and region. Values under various scenarios are provided to enable risk and uncertainty assessments. This resource supports scenario modelling, investment planning, policy design, and benchmarking in the context of decarbonisation pathways. While the data are drawn entirely from existing sources, the novelty lies in the structured harmonisation, metadata processing, and comprehensive coverage, making it suitable for techno-economic evaluation and robust energy system modelling.
Background & Summary
Energy system models are crucial for helping policymakers, researchers, and industry leaders figure out the best path to a sustainable energy future1,2. However, these models rely heavily on cost projections for different energy technologies3. Recent studies have shown that many of these projections remain overly pessimistic, especially for rapidly advancing technologies such as solar PV and batteries4. This can bias scenario outcomes, misguide infrastructure planning, and potentially slow down the clean energy transition.
Access to well-organised and relevant cost data is essential for energy system modellers5. They guide energy system planning analyses to select the most efficient and cost-effective technologies6, ensuring that future energy systems are designed to achieve the best possible balance between cost, performance, and sustainability7. Previous studies have made valuable contributions by compiling renewable electricity generation technology cost data up to 20188, helping lay the groundwork for modelling efforts. However, as the energy sector continues to evolve rapidly, there is a growing need for more current and consistent data9. Without it, modelling outcomes can be distorted and potentially affect budget planning and policy decisions. Inaccurate or outdated inputs risk steering investments toward less effective technologies10, which may ultimately hinder the pace of the clean energy transition11 and delay the achievement of climate goals12.
This work presents a harmonised compilation of cost projections for key clean energy and emerging technologies. We focus on studies and reports published since 2020, as this period reflects the most up-to-date assumptions around technology learning rates, market dynamics, and policy contexts. Additionally, earlier studies have been comprehensively synthesised in8, reducing redundancy and allowing us to build on that foundation with more recent insights. Unlike primary datasets that involve new data collection or measurements, this dataset is entirely built on secondary data from peer-reviewed and institutional sources. Its value lies in the breadth of sources, temporal and spatial resolution, systematic cleaning and standardisation, and comprehensive tagging with metadata. We included:
-
Utility-scale photovoltaics (PV) with installed capacity more than 1 MW, and rooftop PV (5–50 kW-scale), onshore and offshore wind power (grid-scale), stationary Li-ion batteries (grid-scale), Concentrated Solar Thermal Power (CSP) plants, Alkaline (ALK) and Proton Exchange Membrane (PEM) electrolysers (units with capacity of at least 1 MWe).
-
Two main cost indicators, Capital Expenditures (CAPEX) and Levelised Cost of Electricity/Hydrogen (LCOE/H)
-
Data from diverse regions on national, continental, and global scales (depicted in Fig. 1).
Fig. 1 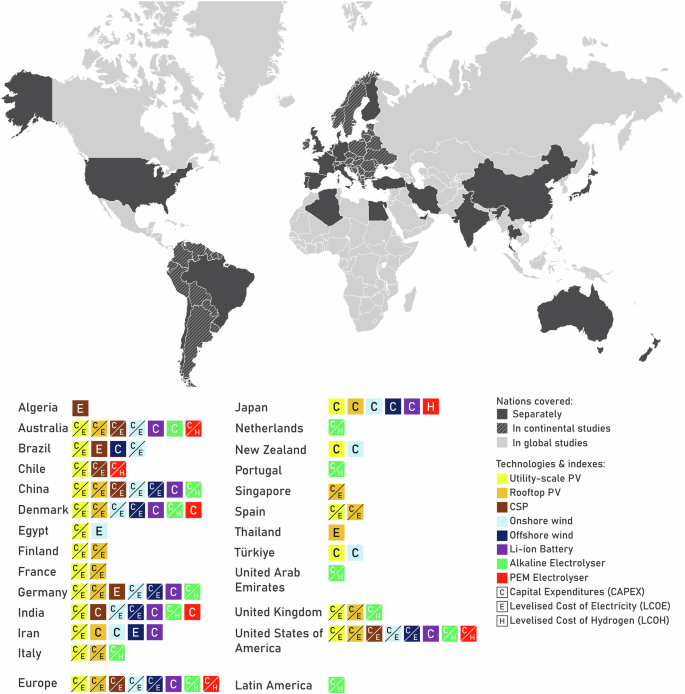
Geographical regions covered in the compiled data provided in this study, and technology diversity in the cost projections provided for each region.

This selection of technologies is grounded in both relevance and comparability across studies. Utility-scale solar and wind power are now the lowest-cost sources of additional clean generation in many regions, with cost projections driving investment decisions and policy planning. With the rising shares of PV being installed in the residential sector, rooftop PV systems are resulting in lower electricity costs than the grid electricity prices13. CSP plants are included due to their ability to deliver dispatchable renewable electricity using integrated thermal energy storage, making them a valuable complement to variable renewables in regions with high Direct Normal Irradiance (DNI) such as North Africa, the Middle East, Australia, and the southwestern United States14,15. Li-ion stationary battery storage technologies are increasingly being deployed and analysed alongside variable renewable energy due to their capability in playing various roles in system operation, such as energy arbitrage, primary/secondary/tertiary responses, congestion management, and demand-side management16,17. Clean hydrogen has an emerging role as a seasonal power balancing option and energy vector to decarbonise hard-to-abate sectors18,19. Clean hydrogen is also one of the core elements of the future Power-to-X economy20, with an expected demand of around 61 PWhLHV of hydrogen21.
While technologies such as geothermal, bio-energy, and nuclear power also contribute to clean energy transitions, they were excluded from this dataset due to 1) the limited availability of high-resolution, forward-looking cost projection data across as many scenarios and regions as is available for the four selected technologies; 2) their lower relevance in many decarbonisation pathways, especially in smaller or islanded systems; and 3) the complexity of comparing their cost structures directly, given their high site specificity and non-standardised configurations22,23. Some of the data reported here are also used in related publications24,25, which examine the intrinsic over-pessimism in cost projections of clean electricity and green hydrogen production technologies.
This database is intended to be useful in developing and implementing strategies for transitioning to renewable energy systems, performing economic analyses comparing the costs and benefits of different renewable energy technologies in the context of a defined geographical region, and evaluating the potential market development trends and future costs of renewable energy technologies. Specifically, the dataset enables:
-
Techno-economic scenario modelling: The standardised cost trajectories across key technologies allow planners and modellers to construct or calibrate future energy system scenarios, particularly for Integrated Resource Plans (IRPs), national energy strategies, and net-zero roadmaps.
-
Investment and policy prioritisation: By providing projections from over 100 studies, the database helps identify where and when specific technologies become cost-competitive. This is critical for determining optimal timing for public or private investments and for designing targeted policy incentives.
-
Risk and uncertainty assessment: The inclusion of minimum, average, and maximum cost projections enables users to assess the range of potential outcomes and uncertainties, supporting robust decision-making under uncertainty (e.g., via stochastic modelling or sensitivity analyses).
-
Technology benchmarking: The database allows users to benchmark national or regional assumptions (e.g., in power system models or hydrogen strategies) against a global range of published projections, identifying whether they are aligned with, optimistic about, or lagging international trends.
-
Cross-sectoral integration analysis: In particular, the inclusion of battery storage and renewable hydrogen supports modelling of demand-side flexibility, sector coupling, and deep decarbonisation pathways involving power-to-gas (e.g., hydrogen), power-to-heat, and power-to-liquid fuels, often referred to as “power-to-x” solutions.
These functionalities are made possible by consistent formatting, temporal granularity (annual data to 2050), and metadata inclusion (e.g., region, source type, and publication year).
Methods
Figure 2 shows the process for collecting, analysing, and aggregating data for this work. After identifying the necessary keywords (available in Table 1), we searched for published articles within different academic repositories such as Web of Science, Scopus, and IEEE Xplore (for journal papers), governmental and state-funded institutes’ websites (for reports), industries and corporates (for white papers), and NGO entities (for annual outlooks). We then classified those reports into four categories: (1) academic journal papers, (2) governmental update reports, (3) commercial/industrial white papers, and 4) NGO annual outlooks. At this stage, we were considering over 120 analyses. The next step included filtering the reports based on two criteria: (1) reports must include at least one set of projection modelling results for each scenario assessed, and (2) they must have been published after 2020. We have applied an exception to the second criterion for the Annual Technology Baseline (ATB) reports of the National Renewable Energy Laboratory (NREL) of the United States (U.S.), the International Energy Agency’s (IEA) World Energy Outlooks (WEO), renewables cost projections for Germany from the Fraunhofer Institute for Solar Energy (ISE) Systems, European Technology and Innovation Platform updates for Photovoltaics (ETIP PV), and generation technology cost projections for Australia from the Commonwealth Scientific and Industrial Research Organisation (CSIRO). These exceptions were made because these reports provide frequent updates on their projections, enabling a mechanism to monitor and record the changes in projection trendlines for major renewable electricity technologies (solar PV, onshore wind power, and offshore wind power).

Workflow for the compilation of energy technology cost data.
The filtering process resulted in 117 suitable reports. We manually reviewed the data records within each report and excluded those that used cost assumptions from studies earlier than 2015 for their projection modelling (to ensure we captured the potential impact from the Paris Agreement). We then screened the remaining 114 reports to collect the necessary data for our study, which included investment costs and levelised costs of electricity and hydrogen. We have used the projection data from those reports as our inputs. For the rest, we have labelled them as “unrelated records”. Unrelated records include the assumptions made to obtain projections, such as discount rates, learning rates, and technology lifetime. Finally, data points that significantly deviated from the mean and could not be explained by regional or technological differences were also excluded from the final dataset of the current paper.
The remaining data went through a “processing” stage. To ensure consistency and comparability across sources, several processing steps were applied to the collected cost projection data:
-
Geographical Averaging: In many cases, individual studies reported separate cost projections for multiple regions within a single country (for example, different solar irradiance zones across the U.S. in the NREL ATB). Where appropriate, we averaged these regional values to obtain a single, country-level cost projection. This approach aligns with our assumption that each country is treated as a single node in the context of long-term energy system modelling. Similarly, for European Union-level data, such as those from the ETIP PV reports, we averaged values reported for several representative cities across different parts of Europe (e.g., London, Munich, Toulouse, Rome, Malaga, Helsinki) to generate an average and a cost range for Europe as a whole.
-
Standardising Component Inclusions: In some older datasets, certain technology cost components were not fully accounted for. For example, in the NREL ATB utility-scale PV CAPEX data from 2015 to 2019, the CAPEX was reported in USD/kWdc, representing the solar module costs only. However, the PV CAPEX reported in studies from 2020 onwards were in USD/kWac, including the system output cost. To harmonise these datasets and enable meaningful comparison over time, we applied a correction factor of 1.34 to the older NREL values, following the guidance provided in the NREL ATB documentation26. DC/AC ratios for utility-scale PV typically fall between 1.1 and 1.527. However, various references use values closer to 1.2 as a typical default28. While the value applied in this work lies at the higher end of the usual range, it was chosen to reflect NREL’s own standardisation practices and ensure consistency across the full time series. We acknowledge that these ratios can vary significantly depending on installation type, project location, and local regulatory frameworks. Therefore, users interested in more granular or location-specific modelling should consider adjusting this factor based on system configuration.
-
Filling Gaps and Smoothing Trends: When a report provided only minimum and maximum cost projections, without an average or median value, we estimated the average ourselves, by averaging the minimum and maximum, to allow for consistent comparison across studies. This simple approach is used due to the absence of further statistical information of input data. This step ensured each dataset contributed consistently to the final visualisations and trend analyses.
These processing steps were necessary to unify diverse data sources into a coherent and usable format for long-term techno-economic analysis and cross-regional comparison. Overall, we used data from 114 studies29,30,31,32,33,34,35,36,37,38,39,40,41,42,43,44,45,46,47,48,49,50,51,52,53,54,55,56,57,58,59,60,61,62,63,64,65,66,67,68,69,70,71,72,73,74,75,76,77,78,79,80,81,82,83,84,85,86,87,88,89,90,91,92,93,94,95,96,97,98,99,100,101,102,103,104,105,106,107,108,109,110,111,112,113,114,115,116,117,118,119,120,121,122,123,124,125,126,127,128,129,130,131,132,133,134,135,136,137,138,139, with over 33,000 data records to compile our final cost projection database. A list of reports is available in Supplementary Table 1.
We have compiled the extracted data in an Excel workbook. The workbook contains individual sheets dedicated to each renewable electricity technology, including Utility-scale PV, Rooftop PV, Onshore wind power, Offshore wind power, CSP, stationary Li-ion batteries, Alkaline, and PEM electrolysers. For each technology, there are two cost indicators: CAPEX and LCOE projections. In addition, we have compiled both CAPEX and LCOE data for all relevant technologies from major institutional sources: NREL ATBs, IEA WEOs, CSIRO, Fraunhofer ISE, and ETIP PV reports. We have included data from reports published before 2020 in the reports from those five institutions, in contrast to the others, which contain only forward-looking projections from 2020 onwards. The following sub-sections will describe the data included from various studies and explain how we obtained and displayed the records from those reports, in special cases. Section (a) provides details on how data was acquired from academic and industrial publications. Section (b) provides further details on data processing for NREL ATB reports, and Section (c) explains how the cost data was extracted from IEA WEO reports.
Academic studies and published reports
In this category, we either used the data provided within the text of those papers or supplementary files. We applied adjustments for variations in currency and inflation rates throughout the analysed timeframe. Cost figures were standardised to USD 2024 by multiplying costs from the studies with inflation rates derived from the Consumer Price Index (CPI) of the U.S. Bureau of Labour Statistics, and currencies were converted using average annual exchange rates for each region (Eq. 1). In the absence of numerical data, we extracted values from visual graphics of cost projections or explanations provided within the publication on the assumptions made for the projection. For electrolyser technologies, we also included information about the electricity sources assumed in their cost projections. This supports clearer comparison and tracking of the capital costs (CAPEX) and levelised cost of hydrogen (LCOH) for green hydrogen production.
National renewable energy laboratory annual technology baseline reports (NREL ATB) 2015–2024
For NREL ATB studies29,30,31,32,33,34,35,36,37,38, we used the latest spreadsheets published by the NREL team. Those spreadsheets include the technical details, structural specifications, cost assumptions, and projections for the future for each of the present technologies in the United States. In earlier versions of these spreadsheets, the range of generation and storage technologies was limited. For instance, no data was included regarding various types of onshore wind power (central or distributed), offshore wind power (fixed-bottom or floating), rooftop PV (either residential, commercial, or industrial), and battery energy storage (utility-scale, commercial, residential, or coupled with solar PV). NREL ATB reports have presented different projections under three scenarios consistently: (1) Conservative: a scenario in which the technology changes little from today, and progress is driven mainly by historical investments and existing industrial learning, (2) Moderate: current levels of research innovation continue, making today’s emerging technologies more widespread and leading to steady, expected improvements in technology, and (3) Advanced: this scenario assumes breakthrough innovations (e.g., improved efficiency) and new technology architectures that are very different from today’s, accelerating transformation across the market. Where sources provided data for different classifications within one category of technology, we adopted the following approach:
-
We used the highest of the costs in conservative scenarios and the lowest of the costs in advanced scenarios reporting the maximum and minimum cost ranges, respectively.
-
We then averaged the rest of the costs for all the classifications to determine the midpoint (e.g., in the case of utility-scale solar PV for the year 2024, the NREL ATB dataset has 10 different classifications, each representing the cost of installation in areas with different Global Horizontal Irradiance (GHI) levels in the U.S.).
-
Lastly, if the cost was the same in all three technology scenarios (conservative, moderate, and advanced), like in some older NREL databases, we used the common values.
International energy agency (IEA) world energy outlook (WEO) cost projections 2000–2024
In the case of WEO projections39,40,41,42,43,44,45,46,47,48,49,50,51,52,53,54,55,56,57,58,59,60, we used LCOE data provided directly in the reports (e.g., appendices or in-text data) without performing any additional calculations, as we had limited access to the required cost assumptions and calculation processes within the IEA energy transition model. For CAPEX values, we used data in the reports when available and calculated values when data was not available following Eq. 1:
The investment parameter includes aggregated capital expenditures for the mentioned capacity development (in billion USD). The currency equivalence rate (CER) is the required rate for inflation adjustment rates derived from the (CPI) of the U.S. Bureau of Labor Statistics. Given the diversity across the annual WEO reports in terms of data presentation and availability we made manual adjustments to calculate CAPEX, as summarised in Table 2.
Data Record
The data has been compiled into two structured Excel workbooks, available through a public Zenodo repository140. The first Excel spreadsheet has 21 sheets. The “Conversion rates” sheet includes all the currency conversion rates used to adjust older studies to the inflation rate. The next eight sheets include compiled projections for CAPEX of different technologies. These sheets are both named and colour-coded based on the provided legend in Fig. 3. The following seven sheets are also dedicated to the compiled LCOE projections. The last five sheets are for the NREL ATBs, IEA WEOs, CSIRO Gen-Cost, Fraunhofer ISE, and ETIP PV reports. The second spreadsheet is a machine-friendly version of the first spreadsheet, for higher readability in coding processes. This spreadsheet also follows the same structure as the first one, with differences in column titles. The column titles in each sheet include the study identifiers (refer to Supplementary Table 1), and scenario names (e.g., Breyer_et_al_(EU)_min shows the lowest projected costs available in61 that provides cost projections for Europe). Column titles in the last five sheets that are for the NREL ATBs, IEA WEOs, CSIRO Gen-Cost, Fraunhofer ISE, and ETIP PV reports, include the cost index, the technology, and variants for scenarios in addition to the previous title structure (e.g., OEDI_2024_(US)_Utility_PV_CAPEX_Advanced shows the projected CAPEX under the “Advanced” scenario for Utility-scale PV in29 that provides cost projections for the U.S.). The usage of underscores instead of space in column titles is to facilitate higher readability during coding.

Illustrated view of the compiled workbook.
For academic studies, projections are categorised as “min”, “mean”, and “max” values, reflecting the sensitivity ranges reported in each study. For institutional datasets from NREL, IEA, Fraunhofer ISE, ETIP, and CSIRO, we preserved the original scenario names provided by the sources. For example, IEA WEO had Stated Policies Scenario (STEPS), Announced Pledges Scenario (APS), Sustainable Development Scenario (SDS), and Net Zero Emissions Scenario (NZE). CSIRO reports used “450 ppm” and “550 ppm” in the 2015 report, and “2 °C” and “4 °C” in the 2017–2018 report, which were directly reflected in our spreadsheet.
For comparability across studies and years, all cost values are expressed in USD per kW (for CAPEX) or USD per MWh (for LCOE) and are inflation-adjusted to 2024 USD. Each sheet is organised by calendar year (typically 2015–2050, except for the institutional datasheets), with columns for cost values (min., mean, max., or scenario-based) from multiple sources. This layout supports a wide range of queries and analyses, including comparing mean CAPEX or LCOE values from several studies for a specific year (e.g., 2035), analysing the range (min. to max.) of projections for a single country (e.g., India, China, US), tracking long-term cost trends for a given technology across studies, and examining institutional scenario pathways (e.g., how IEA’s NZE compares to APS or STEPS). An illustrative view of a sheet is available in Fig. 3.
Technical Validation
To ensure the compiled database is valid for use by other studies, we have gone through a series of steps to gather, clean, and organise our database. We used CAPEX and LCOE/H data for renewable electricity and green hydrogen production technologies from peer-reviewed journal papers, annual reports from reputable institutions (e.g., U.S. national laboratories), and globally recognised energy databases such as IRENA and IEA WEOs. We also incorporated a limited number of industry reports that are widely used in energy system modelling studies and have been referenced in multiple reputable academic journals. Specifically, we included:
-
BloombergNEF Hydrogen Economy Outlook (2020)62,
-
BloombergNEF New Energy Outlook (2021)63,
-
BloombergNEF Battery Pack Prices (2023)64,
-
British Petroleum Energy Outlook (2022)65,
-
E Source Battery Market Forecast (2022)66,
-
General Electric Future of Energy White Paper (2021)141.
These reports were selected because their methodologies are based on validated modelling approaches, extensive expert consultation, and scenario-based assessments, often comparable in rigour to academic methods. Moreover, each has been cited in at least two to three peer-reviewed journal articles, confirming their acceptance by the scholarly community. For example, the BNEF 2020 is cited in142,143,144. The BNEF 2021 report is also cited in145, and146, which the latter is an extended study based on the same model used for the report. The BP and General Electric reports have been referenced in147,148 and149,150, respectively. The consistent use of these sources across diverse studies demonstrates their reliability and relevance in modelling clean energy transitions and technology cost pathways. While it is challenging to validate the compiled data, we relied on the validation approaches published by those studies to ensure our compiled database was as validated as possible. These sources each rely on their own internal or external (e.g., scientific peer review) validation.
To ensure data validity, a thorough cross-verification process was applied wherever possible, comparing data from multiple sources within the same regions and periods. Figure 4a–d compares various continental and regional cost projections for utility-scale PV and onshore wind power technologies in Europe and Asia, respectively. The degree of consistency across multiple independent studies, alongside the alignment with established data from widely recognised sources like the IEA, provides confidence that the projection data from the selected studies for all those regions are reliable for use in further analyses. Unfortunately, we could not replicate the same comparison for the projections for other regions due to the limited number of studies available.

CAPEX projections from different studies for utility-scale PV and onshore wind power technologies in two regions: (a) utility-scale PV in Europe, (b) onshore wind in Europe, (c) utility-scale PV in Asia, and (d) onshore wind in Asia. The black solid line in each subplot represents the historical CAPEX trend for the corresponding technology, and the shaded grey area around it indicates the range of observed historical costs.
For other regions in the world, we found that the IEA WEOs only give future CAPEX estimates for renewable electricity technologies in four big markets: China, India, Europe, and the U.S. These estimates were carefully checked by analysing data from over 750 manufacturing plants. The analysis compared both capital and operational costs between regions. Also, it included ongoing expenses (operational costs), financial support (like government incentives), and non-cost factors such as market size, political stability, and rules about the environment, society, and governance. Because this process was so thorough, we decided it was safe to use the IEA’s cost range, from China as the lowest-cost case to the U.S. as the highest-cost case, as a guide when reviewing other studies. We found that nearly all other cost projections fall within this IEA range. This makes us more confident that the projections from other countries are reliable and suitable for future analysis. The data we provide also serves as a useful reference for anyone who wants to double-check or compare later on.
Usage Notes
The dataset is provided in an Excel spreadsheet format with column names reflecting the column identifiers mentioned in Supplementary Table 1 and scenario titles in each study. This is to facilitate interoperability with common energy modelling tools (e.g., Excel-based models, Python scripts). Users should note that the dataset is intended primarily for forward-looking techno-economic analysis and may not fully reflect historical cost data or context-specific assumptions (e.g., local taxes, labour costs, or financing conditions). The projections are inflation-adjusted, but users are encouraged to consult original sources, referenced in Supplementary Table 1, for methodological details and assumptions behind each scenario.
One of the main limitations of this study is the lack of sufficient data for countries beyond those we found. Many regions, particularly in the developing world, have limited publicly available data on CAPEX and LCOH/E for energy technologies. Additionally, we had to rely on extracting values from visual open-access resources, particularly in reports where the underlying data and assumptions were not provided. Another challenge was limited access to resources published in languages other than English. For instance, projections for Chile were sourced from the Chilean Ministry of Energy, but the explanations were originally in Spanish, and similarly, data from Brazil were in Portuguese. While translations were made, the nuances in the original explanations could have impacted our interpretation of these projections.
Code availability
The plotting code used in Fig. 4 is also available at the same public Zenodo repository140 in .m file format and can be accessed with MATLAB 2023b to replicate (https://doi.org/10.5281/ZENODO.16417026).
References
Prina, M. G., Manzolini, G., Moser, D., Nastasi, B. & Sparber, W. Classification and challenges of bottom-up energy system models - A review. Renewable and Sustainable Energy Reviews 129, 109917 (2020).
Majidi, H. et al. Overview of energy modeling requirements and tools for future smart energy systems. Renewable and Sustainable Energy Reviews 212, 115367 (2025).
Ringkjøb, H. K., Haugan, P. M. & Solbrekke, I. M. A review of modelling tools for energy and electricity systems with large shares of variable renewables. Renewable and Sustainable Energy Reviews 96, https://doi.org/10.1016/j.rser.2018.08.002 (2018).
Creutzig, F., Hilaire, J., Nemet, G., Müller-Hansen, F. & Minx, J. C. Technological innovation enables low cost climate change mitigation. Energy Research and Social Science 105, https://doi.org/10.1016/j.erss.2023.103276 (2023).
Pfenninger, S., DeCarolis, J., Hirth, L., Quoilin, S. & Staffell, I. The importance of open data and software: Is energy research lagging behind? Energy Policy 101 (2017).
Vargas-Ferrer, P., Álvarez-Miranda, E., Tenreiro, C. & Jalil-Vega, F. Assessing flexibility for integrating renewable energies into carbon neutral multi-regional systems: The case of the Chilean power system. Energy for Sustainable Development 70 (2022).
Way, R., Ives, M. C., Mealy, P. & Farmer, J. D. Empirically grounded technology forecasts and the energy transition. Joule 6 (2022).
Xiao, M., Junne, T., Haas, J. & Klein, M. Plummeting costs of renewables - Are energy scenarios lagging? Energy Strategy Reviews 35 (2021).
Osorio-Aravena, J. C. et al. Insights for informing energy transition policies – Are decision makers listening to science? The case of Chile. Energy Strategy Reviews 58, 101644 (2025).
Aghahosseini, A. et al. Energy system transition pathways to meet the global electricity demand for ambitious climate targets and cost competitiveness. Appl Energy 331, 120401 (2023).
Creutzig, F. et al. The underestimated potential of solar energy to mitigate climate change. Nature Energy 11, https://doi.org/10.1038/nenergy.2017.140 (2017).
Köberle, A. C. et al. The cost of mitigation revisited. Nature Climate Change 11, pp. 1035–1045, https://doi.org/10.1038/s41558-021-01203-6 (2021)
Zegeer, M. L., Peer, R. A. M. & Haas, J. Can residential energy systems withstand the heat? Quantifying solar photovoltaic and heat pump yields for future New Zealand climate conditions. Environmental Research: Infrastructure and Sustainability 5, 015012 (2025).
Scholz, Y., Gils, H. C. & Pietzcker, R. C. Application of a high-detail energy system model to derive power sector characteristics at high wind and solar shares. Energy Econ 64, 568–582 (2017).
McPherson, M., Mehos, M. & Denholm, P. Leveraging concentrating solar power plant dispatchability: A review of the impacts of global market structures and policy. Energy Policy 139, 111335 (2020).
Schmidt, O., Melchior, S., Hawkes, A. & Staffell, I. Projecting the Future Levelized Cost of Electricity Storage Technologies. Joule 3, 81–100 (2019).
Ardashir, J. F. & Ghadim, H. V. Large-scale energy storages in joint energy and ancillary multimarkets. Energy Storage in Energy Markets: Uncertainties, Modelling, Analysis and Optimization 265–285 https://doi.org/10.1016/B978-0-12-820095-7.00017-0 (2021).
Handique, A. J., Peer, R. A. M. & Haas, J. Understanding the Challenges for Modelling Islands’ Energy Systems and How to Solve Them. Current Sustainable/Renewable Energy Reports 11, 95–104 (2024).
Vatankhah Ghadim, H., Peer, R. A. M., Read, E. G. & Haas, J. How much hydrogen could we need in New Zealand? Understanding the diverse hydrogen applications and their regional mapping. J R Soc N Z https://doi.org/10.1080/03036758.2024.2365306;WGROUP:STRING:PUBLICATION (2024).
Sterner, M. & Specht, M. Power-to-Gas and Power-to-X—The History and Results of Developing a New Storage Concept. Energies 14, 6594 (2021).
Breyer, C., Lopez, G., Bogdanov, D. & Laaksonen, P. The role of electricity-based hydrogen in the emerging power-to-X economy. Int J Hydrogen Energy 49, 351–359 (2024).
Pieńkowski, D. Is nuclear energy really sustainable? A critical analysis on the example of the Polish energy transition plan. Energy for Sustainable Development 78, 101376 (2024).
Bennett, A. & Serrenho, A. C. The Potential Role of Hydrogen in Decarbonization: Exploring Global Supply Chain Impacts and Hydrogen Use in the United Kingdom. Environ Sci Technol https://doi.org/10.1021/ACS.EST.4C14368 (2025).
Vatankhah Ghadim, H., Canessa, R., Haas, J. & Peer, R. Electrolyzer cost projections compared to actual market costs: A Critical Analysis. in IEEE PES ISGT ASIA 2023 IEEE proceedings 5 (IEEE, Auckland, 2023).
Vatankhah Ghadim, H. et al. Are we too pessimistic? Cost projections for solar photovoltaics, wind power, and batteries are over-estimating actual costs globally. Appl Energy (2025).
OEDI. Utility-Scale PV | Technologies | Electricity | ATB | NREL. https://atb-archive.nrel.gov/electricity/2020/index.php?t=su (2020).
IEA PVPS. Snapshot of Global PV Markets 2025 Task 1 Strategic PV Analysis and Outreach PVPS. https://iea-pvps.org/wp-content/uploads/2025/04/Snapshot-of-Global-PV-Markets_2025.pdf (2025).
Jäger-Waldau, A. Snapshot of photovoltaics − March 2025. EPJ Photovoltaics 16, 22 (2025).
OEDI. 2024 Annual Technology Baseline (ATB) Cost and Performance Data for Electricity Generation Technologies. Open Energy Data Initiative (OEDI) https://atb.nrel.gov/electricity/2024/index (2024).
OEDI. 2023 Annual Technology Baseline (ATB) Cost and Performance Data for Electricity Generation Technologies. Open Energy Data Initiative (OEDI) https://atb.nrel.gov/electricity/2023/data (2023).
OEDI. 2022 Annual Technology Baseline (ATB) Cost and Performance Data for Electricity Generation Technologies. Open Energy Data Initiative (OEDI) https://atb.nrel.gov/electricity/2022/data (2022).
OEDI. 2021 Annual Technology Baseline (ATB) Cost and Performance Data for Electricity Generation Technologies. Open Energy Data Initiative (OEDI) https://atb.nrel.gov/electricity/2021/data (2021).
OEDI. 2020 Annual Technology Baseline (ATB) Cost and Performance Data for Electricity Generation Technologies. Open Energy Data Initiative (OEDI) https://atb-archive.nrel.gov/electricity/2020/data.php (2020).
OEDI. 2019 Annual Technology Baseline (ATB) Cost and Performance Data for Electricity Generation Technologies. Open Energy Data Initiative (OEDI) https://www.nrel.gov/docs/fy20osti/74110.pdf (2019).
OEDI. 2018 Annual Technology Baseline (ATB) Cost and Performance Data for Electricity Generation Technologies. Open Energy Data Initiative (OEDI) https://data.nrel.gov/system/files/89/2018-ATB-data-interim-geo.xlsm (2018).
OEDI. 2017 Annual Technology Baseline (ATB) Cost and Performance Data for Electricity Generation Technologies. Open Energy Data Initiative (OEDI) https://data.nrel.gov/system/files/71/2017-ATB-data.xlsm (2017).
OEDI. 2016 Annual Technology Baseline (ATB) Cost and Performance Data for Electricity Generation Technologies. Open Energy Data Initiative (OEDI) https://www.nrel.gov/docs/fy16osti/66944-DA.xlsm (2016).
OEDI. 2015 Annual Technology Baseline (ATB) Cost and Performance Data for Electricity Generation Technologies. Open Energy Data Initiative (OEDI) https://www.nrel.gov/docs/fy15osti/64077-DA.xlsm (2015).
IEA. World Energy Outlook 2024. https://www.iea.org/reports/world-energy-outlook-2024 (2024).
IEA. World Energy Outlook 2023. https://www.iea.org/reports/world-energy-outlook-2023 (2023).
IEA. World Energy Outlook 2022. https://www.iea.org/reports/world-energy-outlook-2022 (2022).
IEA. World Energy Outlook 2021. https://www.iea.org/Reports/World-Energy-Outlook-2021 (2021).
IEA. World Energy Outlook 2020. https://www.iea.org/reports/world-energy-outlook-2020 (2020).
IEA. World Energy Outlook 2019. https://www.iea.org/reports/world-energy-outlook-2019 (2019).
IEA. World Energy Outlook 2018. https://www.iea.org/reports/world-energy-outlook-2018 (2018).
IEA. World Energy Outlook 2017. https://www.iea.org/reports/world-energy-outlook-2017 (2017).
IEA. World Energy Outlook 2016. https://www.iea.org/reports/world-energy-outlook-2016 (2016).
IEA. World Energy Outlook 2015. https://www.iea.org/reports/world-energy-outlook-2015 (2015).
IEA. World Energy Outlook 2014. https://www.iea.org/reports/world-energy-outlook-2014 (2014).
IEA. World Energy Outlook 2013. https://www.iea.org/reports/world-energy-outlook-2013 (2013).
IEA. World Energy Outlook 2012. https://www.iea.org/reports/world-energy-outlook-2012 (2012).
IEA. World Energy Outlook 2011. https://www.iea.org/reports/world-energy-outlook-2011 (2011).
IEA. World Energy Outlook 2010. https://www.iea.org/reports/world-energy-outlook-2010 (2010).
IEA. World Energy Outlook 2009. https://www.iea.org/reports/world-energy-outlook-2009 (2009).
IEA. World Energy Outlook 2008. https://www.iea.org/reports/world-energy-outlook-2008 (2008).
IEA. World Energy Outlook 2006. https://www.iea.org/reports/world-energy-outlook-2006 (2006).
IEA. World Energy Outlook 2004. https://www.iea.org/reports/world-energy-outlook-2004 (2004).
IEA. World Energy Outlook 2003. https://www.iea.org/reports/world-energy-outlook-2003 (2003).
IEA. World Energy Outlook 2002. https://www.iea.org/reports/world-energy-outlook-2002 (2002).
IEA. World Energy Outlook 2001. https://www.iea.org/reports/world-energy-outlook-2001 (2001).
Breyer, C. et al. Reflecting the energy transition from a European perspective and in the global context—Relevance of solar photovoltaics benchmarking two ambitious scenarios. Progress in Photovoltaics: Research and Applications 31 (2023).
BNEF. Hydrogen Economy Outlook. Bloomberg New Energy Finance (2020).
BNEF. New Energy Outlook 2021. BNEF (2021).
BNEF. Lithium-Ion Battery Pack Prices Hit Record Low of $139/kWh. BNEF https://about.bnef.com/blog/lithium-ion-battery-pack-prices-hit-record-low-of-139-kwh/ (2023).
BP. BP Energy Outlook 2022 edition. British Petroleum 109, https://www.bp.com/en/global/corporate/energy-economics/statistical-review-of-world-energy.html (2022).
Gordon, D. Battery market forecast to 2030: Pricing, capacity, and supply and demand. E Source https://www.esource.com/report/130221hvfd/battery-market-forecast-2030-pricing-capacity-and-supply-and-demand (2022).
DEA. Technology Data for Generation of Electricity and District Heating. Danish Energy Agency https://ens.dk/en/analyses-and-statistics/technology-data-generation-electricity-and-district-heating (2025).
Graham, P., Hayward, J. & Foster, J. GenCost 2024-25 Consultation Draft. www.csiro.au/en/contact (2025).
Kost, C., Müller, P., Sepúlveda Schweiger, J., Fluri, V. & Thomsen, J. Levelized Cost of Electricity - Renewable Energy Technologies (Jul. 2024). www.ise.fraunhofer.de (2024).
Graham, P., Hayward, J. & Foster, J. GenCost 2023-24 Final Report. www.csiro.au/en/contact (2024).
Graham, P., Hayward, J., Foster, J. & Havas, L. GenCost 2022-23 Final Report. www.csiro.au/en/contact (2023).
Bogdanov, D. et al. Energy transition for Japan: Pathways towards a 100% renewable energy system in 2050. IET Renewable Power Generation 17 (2023).
Mandys, F., Chitnis, M. & Silva, S. R. P. Levelized cost estimates of solar photovoltaic electricity in the United Kingdom until 2035. Patterns 4 (2023).
Neumann, F., Zeyen, E., Victoria, M. & Brown, T. The potential role of a hydrogen network in Europe. Joule 7 (2023).
Transpower. TPM Determination: BBC Assumptions Book. (2023).
Sens, L., Neuling, U. & Kaltschmitt, M. Capital expenditure and levelized cost of electricity of photovoltaic plants and wind turbines – Development by 2050. Renew Energy 185 (2022).
Insel, M. A., Sadikoglu, H. & Melikoglu, M. Assessment and determination of 2030 onshore wind and solar PV energy targets of Türkiye considering several investment and cost scenarios. Results in Engineering 16 (2022).
Gulagi, A. et al. The role of renewables for rapid transitioning of the power sector across states in India. Nat Commun 13 (2022).
Makhloufi, S., Khennas, S., Bouchaib, S. & Arab, A. H. Multi-objective cuckoo search algorithm for optimized pathways for 75% renewable electricity mix by 2050 in Algeria. Renew Energy 185 (2022).
Gandhi, K., Apostoleris, H. & Sgouridis, S. Catching the hydrogen train: economics-driven green hydrogen adoption potential in the United Arab Emirates. Int J Hydrogen Energy 47 (2022).
George, J. F., Müller, V. P., Winkler, J. & Ragwitz, M. Is blue hydrogen a bridging technology? - The limits of a CO2 price and the role of state-induced price components for green hydrogen production in Germany. Energy Policy 167, 113072 (2022).
Janssen, J. L. L. C. C., Weeda, M., Detz, R. J. & van der Zwaan, B. Country-specific cost projections for renewable hydrogen production through off-grid electricity systems. Appl Energy 309 (2022).
Gilmore, N. et al. Clean energy futures: An Australian based foresight study. Energy 260, 125089 (2022).
Graham, P., Hayward, J., Foster, J. & Havas, L. GenCost 2021-22 Final Report. www.csiro.au/en/contact (2022).
IEA. Hydrogen in Latin America: From near-Term Opportunities to Large-Scale Deployment. Hydrogen in Latin America https://iea.blob.core.windows.net/assets/65d4d887-c04d-4a1b-8d4c-2bec908a1737/IEA_HydrogeninLatinAmerica_Fullreport.pdf (2021).
Kost, C., Shammugam, S., Fluri, V., Peper, D., Memar, A. D., & Schlegel, T. Levelized Cost of Electricity - Renewable Energy Technologies. June 2021. pp. 1–45. Fraunhofer ISE. www.ise.fraunhofer.de (2021)
Robert, B. & Brown, E. B. Proyecciones de costos inversión y LCOE. https://energia.gob.cl/pelp/proyecciones-de-costos (2021).
Lu, X. et al. Combined solar power and storage as cost-competitive and grid-compatible supply for China’s future carbon-neutral electricity system. Proc Natl Acad Sci USA 118 (2021).
Graham, P., Hayward, J., Foster, J. & Havas, L. GenCost 2020-21 Final Report. CSIRO https://publications.csiro.au/publications/publication/PIcsiro:EP2021-0160/SQgencost/RP1/RS25/RORECENT/STsearch-by-keyword/LISEA/RI1/RT6 (2021).
AEMO. 2021 Costs and Technical Parameter Review. https://www.aemo.com.au/-/media/Files/Electricity/NEM/Planning_and_Forecasting/Inputs-Assumptions-Methodologies/2019/Aurecon-2019-Cost-and-Technical-Parameters-Review-Draft-Report.PDF (2021).
Zhang, X., Dong, X. & Li, X. Study of China’s Optimal Concentrated Solar Power Development Path to 2050. Front Energy Res 9 (2021).
UK Deparment of Business Energy & Industrial. Hydrogen Production Costs 2021. https://assets.publishing.service.gov.uk/government/uploads/system/uploads/attachment_data/file/1011506/Hydrogen_Production_Costs_2021.pdf (2021).
WEC. Decarbonised Hydrogen Imports into the European Union: Challenges and Opportunities. https://www.weltenergierat.de/wp-content/uploads/2021/10/WEC-Europe_Hydrogen-Import-Study.pdf (2021).
Repenning, J. et al. Projektionsbericht 2021 Für Deutschland. (2021).
Graham, P., Hayward, J., Foster, J. & Havas, L. GenCost 2019-20 Final Report. (2020).
MME & EPE. Plano Nacional de Energia - PNE 2050. Plano Nacional de Energia - PNE 2050 53 (2020).
Barbosa, J., Dias, L. P., Simoes, S. G. & Seixas, J. When is the sun going to shine for the Brazilian energy sector? A story of how modelling affects solar electricity. Renew Energy 162 (2020).
Ghorbani, N., Aghahosseini, A. & Breyer, C. Assessment of a cost-optimal power system fully based on renewable energy for Iran by 2050 – Achieving zero greenhouse gas emissions and overcoming the water crisis. Renew Energy 146 (2020).
ETIP. Fact Sheets about Photovoltaics (PV) - The Cost of PV Systems. European Technology & Innovation Platform https://etip-pv.eu/publications/etip-pv-publications/download/pv-the-cheapest-electricity-source-almost-everyw-2 (2020).
SERIS. UPDATE of the Solar Photovoltaic (PV) Roadmap for Singapore. 76, https://www.seris.nus.edu.sg/doc/publications/Update-of-the-Solar-Roadmap-for-Singapore-(March-2020).pdf (2020).
Chaianong, A., Bangviwat, A., Menke, C., Breitschopf, B. & Eichhammer, W. Customer economics of residential PV–battery systems in Thailand. Renew Energy 146 (2020).
Mongird, K. et al. An evaluation of energy storage cost and performance characteristics. Energies. 13, 3307 https://doi.org/10.3390/en13133307 (2020).
He, X. et al. Greenhouse gas consequences of the China dual credit policy. Nat Commun 11 (2020).
Vartiainen, E., Masson, G., Breyer, C., Moser, D. & Román Medina, E. Impact of weighted average cost of capital, capital expenditure, and other parameters on future utility-scale PV levelised cost of electricity. Progress in Photovoltaics: Research and Applications 28 (2020).
Deorah, S. M., Abhyankar, N., Arora, S., Gambhir, A. & Phadke, A. Estimating the Cost of Grid-Scale Lithium-Ion Battery Storage in India Energy Technologies Area Lawrence Berkeley National Laboratory. (2020).
Resch, G. et al. Market Uptake of Concentrating Solar Power in Europe: Model-Based Analysis of Drivers and Policy Trade-Offs Deliverable 8.2. https://www.isi.fraunhofer.de/content/dam/isi/dokumente/ccx/2020/D8-2_Market uptake of concentrating solar power in Europe (final version).pdf (2020).
Mahone, A. et al. Hydrogen Opportunities in a Low-Carbon Future An Assessment Of Long-Term Market Potential in the Western United States. (2020).
Hall, W., Spencer, T., Renjith, G. & Dayal, S. The Potential Role of Hydrogen in India: A Pathway for Scaling-up Low Carbon Hydrogen across the Economy. Sustainablefinance.Hsbc.Com (2020).
Gallardo, F. I. et al. A Techno-Economic Analysis of solar hydrogen production by electrolysis in the north of Chile and the case of exportation from Atacama Desert to Japan. Int J Hydrogen Energy 46 (2021).
Peterson, D., Vickers, J. & Desantis, D. DOE Hydrogen and Fuel Cells Program Record: Hydrogen Production Cost From PEM Electrolysis 2019. DOE Hydrogen and Fuel Cells Program Record (2020).
ETIP. Fact Sheets about Photovoltaics (PV) - The Cost of PV Systems. (2019).
Tlili, O., Mansilla, C., Frimat, D. & Perez, Y. Hydrogen market penetration feasibility assessment: Mobility and natural gas markets in the US, Europe, China and Japan. Int J Hydrogen Energy 44 (2019).
ETC. China 2050: A Fully Developed Rich Net-Zero Economy. Online https://www.energy-transitions.org/publications/china-2050-a-fully-developed-rich-zero-carbon-economy/ (2019).
Graham, P., Hayward, J., Foster, J., Story, J. & Havas, L. GenCost 2018 Final Report. (2018).
Kost, C., Shammugam, S., Jülch, V., Nguyen, H.-T. & Schlegl, T. Levelized Cost of Electricity - Renewable Energy Technologies (Mar. 2018). www.ise.fraunhofer.de (2018).
Hayward, J. A. & Graham, P. W. Electricity Generation Technology Cost Projections. (2017).
ETIP. Fact Sheets about Photovoltaics (PV) - The Cost of PV Systems. www.etip-pv.eu (2017).
Craigen, J. et al. Australian Power Generation Technology Report. www.co2crc.com.au/publications (2015).
Kost, C. et al. Levelized Cost of Electricity - Renewable Energy Technologies (Nov. 2013). www.ise.fraunhofer.de (2013).
Kost, C., Schlegl, T., Thomsen, J., Nold, S. & Mayer, J. Levelized Cost of Electricity - Renewable Energies (May 2012). www.ise.fraunhofer.de (2012).
DNV. Energy Transition Outlook 2023: A global and regional forecast to 2050. DNV, Remi Eriksen (2023).
Abbott, B. W. et al. Accelerating the Renewable Energy Revolution to Get Back to the Holocene. Earth’s Future 11, e2023EF003639, https://doi.org/10.1029/2023EF003639 (2023).
Rozon, F., McGregor, C. & Owen, M. Long-Term Forecasting Framework for Renewable Energy Technologies’ Installed Capacity and Costs for 2050. Energies (Basel) 16 (2023).
US DoE. Financial Incentives for Hydrogen and Fuel Cell Projects. https://www.energy.gov/eere/fuelcells/financial-incentives-hydrogen-and-fuel-cell-projects (2022).
DNV. Hydrogen Forecast to 2050 Energy Transition Outlook 2022. Dnv (2022).
Jacobson, M. Z. et al. Low-cost solutions to global warming, air pollution, and energy insecurity for 145 countries. Energy Environ Sci 15 (2022).
Reksten, A. H., Thomassen, M. S., Møller-Holst, S. & Sundseth, K. Projecting the future cost of PEM and alkaline water electrolysers; a CAPEX model including electrolyser plant size and technology development. Int J Hydrogen Energy 47, 38106–38113 (2022).
IEA. Global Hydrogen Review. Global Hydrogen Review 2022 (2022).
Teske, S. et al. It is still possible to achieve the paris climate agreement: Regional, sectoral, and land-use pathways. Energies (Basel) 14 (2021).
Grant, N., Hawkes, A., Napp, T. & Gambhir, A. Cost reductions in renewables can substantially erode the value of carbon capture and storage in mitigation pathways. One Earth 4 (2021).
Bogdanov, D., Gulagi, A., Fasihi, M. & Breyer, C. Full energy sector transition towards 100% renewable energy supply: Integrating power, heat, transport and industry sectors including desalination. Appl Energy 283 (2021).
Brändle, G., Schönfisch, M. & Schulte, S. Estimating long-term global supply costs for low-carbon hydrogen. Appl Energy 302 (2021).
Wiser, R. et al. Expert elicitation survey predicts 37% to 49% declines in wind energy costs by 2050. Nat Energy 6 (2021).
Mauler, L., Duffner, F., Zeier, W. G. & Leker, J. Battery cost forecasting: A review of methods and results with an outlook to 2050. Energy and Environmental Science 14, pp. 4712–4739, https://doi.org/10.1039/d1ee01530c (2021).
EPRI. Battery Energy Storage Lifecyle Cost Assessment Summary (2020).
Beuse, M., Steffen, B. & Schmidt, T. S. Projecting the Competition between Energy-Storage Technologies in the Electricity Sector. Joule 4 (2020).
Penisa, X. N. et al. Projecting the price of lithium-ion NMC battery packs using a multifactor learning curve model. Energies (Basel) 13 (2020).
IRENA. Hydrogen: A Renewable Energy Perspective. Report prepared for the 2nd Hydrogen Energy Ministerial Meeting in Tokyo, Japan (2020).
IEA. The Future of Hydrogen - Seizing today’s opportunities. International Energy Agency (2019).
Vatankhah Ghadim, H. Clean technologies cost projections database - V2.0 (Release July 2025). https://doi.org/10.5281/ZENODO.16417026 (2025).
General Electric. Accelerated growth of renewables and gas power can rapidly change the trajectory on climate change. https://www.ge.com/content/dam/gepower-new/global/en_US/downloads/gas-new-site/future-of-energy/ge-future-of-energy-white-paper.pdf (2021).
Osman, M. G., Strejoiu, C. V., Panait, C., Lazaroiu, A. C. & Lazaroiu, G. Microgrid Model for Evaluating the Operational Dynamics of Solar-Powered Hydrogen Production. 2024 9th International Conference on Energy Efficiency and Agricultural Engineering, EE and AE 2024 - Proceedings https://doi.org/10.1109/EEAE60309.2024.10600588 (2024).
Jayakumar, A., Madheswaran, D. K., Kannan, A. M., Sureshvaran, U. & Sathish, J. Can hydrogen be the sustainable fuel for mobility in India in the global context? Int J Hydrogen Energy 47, 33571–33596 (2022).
Fazeli, R., Longden, T. & Beck, F. J. Dynamics of price-based competition between blue and green hydrogen with net zero emissions targets. Renewable and Sustainable Energy Reviews 210, 115244 (2025).
Muratori, M. et al. The rise of electric vehicles—2020 status and future expectations. Progress in Energy 3, 022002 (2021).
Chase, J. View from the Solar Industry: We Don’t Need COP26 to Shine, But What Should We Worry About? Joule 6, 495–497 (2022).
Wang, W., Sun, H. & Yang, L. Analysis and Suggestions on the Scenarios of Integrated Development Between Natural Gas and Other Energy Resources Under the Goals of Peaking Carbon Emissions and Achieving Carbon Neutrality. 193–207 https://doi.org/10.1007/978-981-99-7289-0_12 (2024).
Ravelli, S. Thermodynamic Assessment of Exhaust Gas Recirculation in High-Volume Hydrogen Gas Turbines in Combined Cycle Mode. J Eng Gas Turbine Power 144 (2022).
Moriarty, P. & Honnery, D. Review: The Energy Implications of Averting Climate Change Catastrophe. Energies 2023, 16, 6178 (2023).
Moriarty, P. & Honnery, D. Review: Renewable Energy in an Increasingly Uncertain Future. Applied Sciences 2023 13, 388 (2022).
Acknowledgements
We thank the HINT (New Zealand-German Platform for Green Hydrogen Integration project), which is supported by the Catalyst: Strategic Fund, administered by the Ministry of Business Innovation and Employment of New Zealand and the German Federal Ministry of Education and Research (Grant No. 03SF0690).
Author information
Authors and Affiliations
Contributions
Hadi Vatankhah Ghadim: Conceptualisation, Methodology, Software, Validation, Formal analysis, Investigation, Resources, Data Curation, Writing - Original Draft, Writing - Review & Editing, Visualisation, Jannik Haas: Conceptualisation, Writing - Review & Editing, Supervision, Funding acquisition, Christian Breyer: Resources, Writing - Review & Editing, Hans-Christian Gils: Resources, Writing - Review & Editing, Philip Odonkor: Resources, Writing - Review & Editing, E. Grant Read: Resources, Writing - Review & Editing, Mengzhu Xiao: Resources, Rebecca Peer: Conceptualisation, Writing - Review & Editing, Supervision, Funding acquisition.
Corresponding author
Ethics declarations
Competing interests
The authors declare no competing interests.
Additional information
Publisher’s note Springer Nature remains neutral with regard to jurisdictional claims in published maps and institutional affiliations.
Supplementary information
Rights and permissions
Open Access This article is licensed under a Creative Commons Attribution 4.0 International License, which permits use, sharing, adaptation, distribution and reproduction in any medium or format, as long as you give appropriate credit to the original author(s) and the source, provide a link to the Creative Commons licence, and indicate if changes were made. The images or other third party material in this article are included in the article’s Creative Commons licence, unless indicated otherwise in a credit line to the material. If material is not included in the article’s Creative Commons licence and your intended use is not permitted by statutory regulation or exceeds the permitted use, you will need to obtain permission directly from the copyright holder. To view a copy of this licence, visit http://creativecommons.org/licenses/by/4.0/.
About this article

Cite this article
Vatankhah Ghadim, H., Haas, J., Breyer, C. et al. Clean technology cost projections: investment and levelized costs of solar, wind, battery, and hydrogen. Sci Data 12, 1670 (2025). https://doi.org/10.1038/s41597-025-05951-4
Received:
Accepted:
Published:
Version of record:
DOI: https://doi.org/10.1038/s41597-025-05951-4
