
Abstract
Precision medicine is defined by the U.S. Food & Drug Administration as “an innovative approach to tailoring disease prevention and treatment that considers differences in people’s genes, environments, and lifestyles”. To succeed in providing personalized medicine to patients, it will be necessary to integrate medical, biological and molecular data in order to identify all complex disease subtypes and understand their pathobiological mechanism. Since biomedical knowledge graphs (BKGs) are limited to the integration of prior knowledge data and do not integrate real-world data (RWD) that would allow for the incorporation of patient level information, we propose a first step towards using RWD, BKGs and graph machine learning (ML) to enable a fully integrated precision medicine strategy. In this study, we established a link between RWD and a BKG. Our methodology introduced a novel patient representation using graph ML applied to the BKG. This approach facilitated the interpretation and extension of ML findings, particularly in disease subtype identification with molecular data contained in the BKG. We applied our innovative methodology to deepen our understanding of atopic dermatitis, a condition with a complex underlying pathophysiological mechanism. Through our analysis, we identified seven subgroups of patients each characterized by clinical and genomic characteristics.
Introduction
Precision medicine is defined by the U.S. Food & Drug Administration (FDA) as “an innovative approach to tailoring disease prevention and treatment that takes into account differences in people’s genes, environments, and lifestyles”1. The aim is to provide patients with personalized healthcare that maximises the benefits of treatment while reducing adverse events, enabling the right treatment for the right patient, at the right time.
The promise of this new paradigm is to advance healthcare solutions for the future and to accompany each individual on a personalized health journey, taking into account his or her own risk factors and, if necessary, implementing a therapeutic strategy adapted to the specificity of the patient.
This personalized approach to medical research is now possible thanks to the various sources of available biomedical data and the advent of machine learning (ML)-based analysis methods allowing the development of relevant predictive models learning from large datasets. Among these various sources can be found data that consist of prior knowledge on therapeutic areas such as data from clinical studies, biological databases and ontological databases, and real-world data such as electronic health records (EHRs), insurance claims databases, and patient registries. To succeed in providing personalized medicine to patients, it is necessary to identify disease subtypes and understand the associated molecular mechanisms underlying the pathology. This process, known as identifying diseases endotypes, involves analysing molecular, cellular, immunological, or genetic data to uncover relevant patterns and correlations.
Several works proposed strategies to integrate diverse medical data sources to deepen the understanding of the pathophysiology and endotypes of diseases. Notably, a novel data source called Biomedical Knowledge Graphs (BKGs) has seen widespread development in recent years, enabling the integration of various medical data sources. Moreover, the application of conventional and advanced graph ML techniques to BKGs holds promise for advancing precision medicine tasks. However, to our knowledge, BKGs are mostly limited to the integration of prior knowledge data and do not integrate Real World Data (RWD), which would allow for the incorporation of patient-related data. Indeed, RWD data show the variety and complexity of patients seen in everyday medical practice and allow for a better understanding of the natural history of diseases. Hence, several groups developed Knowledge Graphs from RWD to explore the complexity of these rich sources of patient’s data, however, they lack molecular information2,3,4. Using both the richness of RWD such as EHRs and BKGs may unveil novel insights on the endotypes of diseases, as demonstrated by two recent articles in which the same method is used either to link endotypes to molecular entities5, or to predict the early onset of Parkinson’s disease6. The work we propose is a first step towards using EHRs, BKGs and graph ML in a fully integrated precision medicine strategy for identifying disease endotypes.
The aim of our study is to develop a novel approach to find endotypes using biomedical graph analysis in combination with real-world evidence. We applied our methodology to atopic dermatitis (AD), with the aim to not only identify and characterize the disease endotypes of AD, but also to identify the biological and molecular evidence that is associated with each subtype. AD is a chronic, relapsing inflammatory skin disease that is characterized by the upregulation of type 2 immune responses (including those involving type 2 helper T cells), an impaired skin barrier function, and increased staphylococcus aureus colonization7. Despite that, AD affects up to 30% of the paediatric population and 2–10% of adults8, there are still many unmet medical needs. In fact, there is no universally accepted treatment target, and plans are currently underway for personalized medicine8. Identifying AD endotypes would facilitate more accurate diagnosis and treatment and allow the development of targeted drugs for individual patients.
Contributions
We present an innovative methodology to link RWD to a BKG to augment clinical patient representations and further improve ML-based results through ontological knowledge integration.
-
We demonstrate the feasibility of mapping EHRs to BKGs which underscores the effectiveness of our approach in integrating diverse data sources.
-
We propose an approach that bridges the gap between patient data and comprehensive patient representations giving deeper insights into the underlying biological mechanisms of diseases.
-
Furthermore, we show the potential of using multimodal data and graph representation learning (GRL) to interpret and extend ML results, which is particularly important in interdisciplinary studies at the intersection of ML and medicine.
Related work
Several works have proposed strategies to integrate diverse medical data sources to deepen the understanding of the pathophysiological mechanism underlying diseases.
Biobanks and genetic variant association
Biobanks like Finngen9 and UK-Biobank10 have enabled the exploration of associations between phenotypes and genetic variants through integrated clinical, phenotypic, and genomic data. However, their application is suited to monogenic diseases and presents challenges in understanding complex diseases due to the diverse nature of molecular pathways.
Graph-based information representation
In recent years, the adoption of graph-based information representation has emerged as a pivotal strategy for integrating diverse medical data sources to respond to biomedical applications. Both public11,12,13,14,15,16,17,18 and commercial19,20,21 BKGs have been developed from literature and various biological databases.
Advanced graph analysis techniques
Leveraging conventional graph search methods like distance measurement and similarity, alongside advanced graph ML techniques such as edge inference and graph representation learning, researchers have been able to explore precision medicine tasks using BKGs. These tasks include discovering novel therapeutic targets, identifying drug repurposing opportunities, and predicting molecule toxicity14. These innovative approaches represent a significant advancement in biomedical research, offering promising insights for therapeutic discovery and scientific exploration.
Materials and methods
Our study presents the development of an analytical pipeline designed to effectively integrate EHRs with a BKG for the purpose of generating novel patient representations. This integration aims to augment the interpretability and extendibility of ML outcomes through the utilization of these refined patient representations. Notably, our pipeline is meticulously engineered to ensure modularity, with each step operating independently of the others. This modular design facilitates rigorous testing and comparison of various methodologies at each stage of the pipeline. Figure 1 shows the high-level overview of the pipeline that has been developed for this study.

Overview of the developed framework to integrate EHRs and a BKG to identify patient endotypes. Step 1 involves cohort creation, extraction of its clinical characteristics, and their mapping to medical concepts in the BKG. In Step 2, the BKG is enriched by incorporating potential new medical concepts derived from EHRs but not present in the BKG. Step 3 focuses on graph representation learning, where embeddings are generated for each node in the BKG and utilized to augment the standard binary patient representation. Finally, Step 4 illustrates the clustering process applied to the augmented patient representation to identify subgroups. These subgroups are then described based on clinical characteristics sourced from EHRs and relations identified in the BKG.
Data
Optum’s de-identified integrated claims-clinical dataset
Optum provided description (quoted directly)22: “Optum’s Integrated Claims-Clinical dataset combines adjudicated claims data with Optum’s de-identified Integrated Claims-Clinical dataset. Optum’s Integrated Claims-EHR dataset is statistically de-identified under the Expert Determination method consistent with HIPAA and managed according to Optum® and customer data use agreements. The Integrated dataset, which leverages a proprietary Optum algorithm that uses both salting and cryptographic hashing, links both claims and clinical data on matched individuals. The Integrated dataset includes historical, linked administrative claim data from pharmacy claims, physician claims, and facility claims, with EHR information, inclusive of medications prescribed and administered, lab results, vital signs, body measurements, diagnoses, procedures, and information derived from clinical notes using Natural Language Processing.”
iBKH: The integrative biomedical knowledge hub
iBKH23 integrates data from 18 publicly available biomedical databases. The current version of iBKH contains a total of 2,384,501 entities of 11 types. For the relationships in the iBKH, there are 86 relation types within 18 kinds of entity pairs, including Anatomy-Gene, Drug-Disease, Drug-Drug, Drug-Gene, Disease-Disease, Disease-Gene, Disease-Symptom, Gene-Gene, DSI-Disease, DSI-Symptom, DSI-Drug, DSI-Anatomy, DSI-DSP, DSI-TC, Disease-Pathway, Drug-Pathway, Gene-Pathway and Drug-Side Effect. In total, iBKH contains 48,194,646 relations.
Graph deployment and enrichment
We deployed the iBKH23 on Neo4j 4.4.11 within an AWS environment24.
The study population was created from Optum’s Integrated Claims-Clinical dataset22, which includes a total of 107 million U.S. patients’ records. AD patients were identified by selecting those with at least two AD diagnoses i.e., either ICD-9 (6918, 69012) or ICD-10 codes (L20.0, L20.81, L20.82, L20.83, L20.84, L20.89, L20.9). Patients with inconsistent birth date or missing gender were excluded. Any patient who did not meet the inclusion criteria for AD and who did not have “eczema” or “dermatitis” (terms referring to AD) in the reported provider notes associated to their medical record was a candidate for the control cohort. The control population was established to serve as a comparative group against the study population. This control group will be utilized as a reference for subsequent graph enrichment and interpretation of results. Controls were randomly matched to AD patients (ratio 1:5) on gender, region, race, birth year, data coverage (defined as the number of years between their first and last record in the database).
An index date identifying disease onset was defined as the first date of any AD diagnosis. For control patients, a fictive index date was created by adding the duration of the look-back period of their associated matched AD patient to the date of their first record.
Clinical features of the study population were extracted over lifetime. Those selected for the study included diagnoses (ICD-9/ICD-10 codes and SDS terms which are medical terms extracted and structured from clinical notes by the Integrated dataset), and treatments.
To link the Integrated dataset22 to iBKH23, a mapping between entities was performed using the Unified Medical Language System (UMLS), a collection of many controlled biomedical vocabularies which includes a mapping between terms25. Several approaches were used to map features from the Integrated dataset to nodes from the iBKH: ICD codes were mapped with tables from the UMLS Concept Unique Identifiers (CUI); SDS terms were mapped using the natural language processing and named entity recognition Python library ScispaCy (version 0.5.1) to predict their associated CUI. Prescriptions were mapped using text processing and exact string matching on generic names of drugs. To select only features that carry signal and avoid including noise, the mapped features were then filtered to a prevalence of at least 5% in the AD cohort. Features were encoded using a binary indicator (1/0) for presence/absence during the observation period. The final study population was filtered on patients with at least 10 clinical features, including at least 5 diseases.
A challenge in combining a BKG with RWD is that the BKG may not contain all concepts (symptoms, treatment or diseases) present in the RWD. Inspired by the work of Rotmensch et al.26, we proposed the following approach to overcome this challenge. iBKH was enriched with diseases and symptoms that were present in the cohort but not in the graph. For this enrichment step, patients with at least 10 symptoms and 10 diseases were included to train symptoms-disease models. One model by disease was trained to learn relations between symptoms and diseases. More specifically, a logistic regression model was trained on 80% of the data to predict based on symptoms whether patients had or not each disease. The classification performance was further validated on a testing set (20% of the data). The coefficients of the models were used to compute odds ratio (OR) for each symptom-disease relation. The area under curve (AUC) was chosen to select valid models. All models with an AUC on the testing set greater than 0.7 were selected. Finally, from the complete list of new symptom-disease relations, only those with a high OR and with a clear medical relation with AD (according to medical experts in the field) were selected. These criteria of section lead to select symptom-disease relations with an associated ORi = eβi > 1.9 (where βi is the coefficient of the symptom i for a given disease model), a new relation was created in the graph if it did not already exist (Fig. 2).

Process to create symptom-disease relations in the graph based on classifiers trained on EHRs. Logistic regression models were trained for each disease to understand symptom-disease associations. These models were trained using a train-test framework to predict whether patients exhibited the disease based on symptoms. Models with acceptable predictive performance (AUC greater than 0.7 on the testing set) were selected. Symptom-disease relations were quantified using odds ratios (OR) derived from the coefficients of the models. If a symptom-disease relation had an associated ORi = eβi > 1.9 (where βi represents the coefficient of symptom i for a given disease model), a new relation was incorporated into the graph if not already present.
Graph representation learning
Patients in the study population were represented by binary vectors encoding the presence or absence of clinical features over lifetime. To create a patient representation combining signal from both EHRs and the BKG, GRL was used.
First, node embeddings were computed for each node of the graph using the fast random projection (FRP) algorithm27. This algorithm was chosen for its low computational requirements to overcome the large number of nodes and relations in the selected BKG. Using the FRP algorithm allowed to represent each node of the graph as a low-dimensional vector summarising its position in the graph and the structure of its local neighbourhood. Indeed, the FRP algorithm allows to create an embedding representation that preserves similarity between the graph nodes and their neighbors. Two nodes that have similar neighbourhood in the graph are assigned similar embedding vectors. Conversely, two nodes with different local structure are not assigned similar embedding vectors.
We optimized the FRP algorithm’s hyperparameters to maximize performance in a supervised entity classification task. Specifically, we trained a classifier on node embeddings to classify nodes as disease, symptom, drug, or any other type of node. This multi-classification task was also used to evaluate the embeddings. The capacity of the classifier to classify each node into its type was evaluated with the f1-score.
Since patient characteristics were captured over lifetime and diseases may be the only persistent clinical characteristics over time (a bias could for example be introduced by drug prescriptions since prescribers use different drugs for patients with similar phenotypes), the patient representation was exclusively based on disease nodes. The set of diseases associated with each patient provides a representation of the patient’s general state of health, and in particular the specificity of his immune response (Th1, Th2, Th17/22…). For each patient, disease node vectors were selected and averaged to compute a “patient representation vector” (Fig. 3) as described in the supplemental materialThis allowed to create a patient representation created from signal both originating from EHRs and iBKH. Another way of looking at this is to see patient features from the integrated dataset augmented with medical insights derived from the knowledge graph.

Patient representation vector created by aggregation of disease vectors. For each node of the graph, an embedding was computed to summarize its position and local structure in the graph (a). Then, for each patient, the node embeddings associated with their diseases were selected and averaged to generate a comprehensive patient representation vector (b).
Patients endotyping
Patient representation vectors were then used for finding endotypes of AD. Endotypes are subtypes of a disease including measures of features derived from a molecular, cellular, immunological, or genetic analysis, that may provide insight into mechanisms that explain pathology.
Patient clustering
Patient vectors computed from their individual diseases extracted from EHRs and the corresponding vector nodes in the graph aimed at capturing the medical context of patients. Using embeddings from the graph allowed to include information on the relations between disease, gene and pathway nodes. These vectors were used as inputs to a clustering algorithm to separate sub-groups of patients. The K-means algorithm was chosen to perform clustering and the cosine distance was selected to measure the similarity between data points during the algorithm’s training. The use of cosine distance is particularly advantageous in scenarios where the feature space is high-dimensional, as it focuses on the angle between the vectors rather than their magnitude. The clustering was then optimised using the silhouette score, a widely used metric for evaluating the quality of clustering solutions28. By maximising the silhouette score, the optimal number of clusters could be identified, and the overall cluster separation improved. In order to maintain a reasonable number of clusters to interpret, the silhouette score was not computed beyond 15 clusters. Once subgroups of patients were identified, a specific description of the clusters was performed to link them with potential endotypes of AD.
Cluster description
After clustering, analyses were performed on the clusters to characterize them and retrieve known AD endotypes and phenotypes. The comorbidities used for clustering were described for each cluster in comparison with the overall AD population and the control population. Demographic data and drugs’ prevalence were also described.
Finally, gene nodes from iBKH23 were used to enrich the description of the clusters and allowed the formulation of hypotheses on the underlying mechanisms of their pathophysiology. To do this, genes linked to AD in the graph were selected, as they are supposed to be involved in AD pathophysiology. Among these selected genes, those also connected to the diseases used for clustering were explored. Genes involved in several AD-related diseases were examined, and those related to cluster-specific diseases were highlighted, using the most prevalent comorbidities (Fig. 4).

Capturing genes related to AD and the most prevalent diseases of clusters. Initially, genes associated with AD were identified in iBKH. Then, genes associated with diseases representative of each cluster were examined. A comprehensive literature review was then conducted to determine whether the set of genes was associated with established AD endotypes or biological mechanisms that may underlie AD symptoms.
A literature review was conducted to search for publications mentioning the genes related to specific diseases of clusters and assess if they could define endotypes. Links between these genes and AD mechanisms were investigated.
In addition to AD-related genes, other genes characteristic of some clusters but not directly linked to AD were identified. The literature was assessed to determine if these genes were mentioned and whether they had any potential involvement in AD biological mechanisms.
Results
Graph enrichment and graph representation learning
The AD cohort created from data in Optum’s de-identified Integrated Claims-Clinical dataset22 included 402,000 + patients, i.e., with at least two AD diagnoses. After removing patients with inconsistent birth dates and missing gender fields, the AD cohort consisted of more than 384,000 patients with available data including, diagnoses, structured data fields derived from provider notes, medications, procedures, observations, and laboratory measures.
To select the most relevant clinical features in the AD population, only those above a 5% prevalence in the AD cohort, which resulted in 145 diagnoses and 58 treatments, were included. Of these, 120 diagnoses i.e., 83% (respectively 40 treatments i.e., 69%), were mapped to disease or symptom nodes (respectively drug nodes) in the iBKH.
The control cohort was matched to the AD population on demographics such as age, gender, and race, resulting in identical prevalence. Moreover, coverage was matched using one-year time buckets which explains the slight difference in the average age and coverage in years (Table 1).
The final study population was filtered on patients with at least 5 clinical features and resulted in 199,603 AD and 998,015 matched control patients.
The AD cohort was composed of 46% females (Table 1). The mean age at onset of AD diagnosis was 20 years old (mean = 20, std = 24). 65% of the population was Caucasian, 19% African American and 5% Asian.
The study population was used to enrich the iBKH graph. Of the 85 symptoms-disease models trained, 63 had an area under the curve (AUC) above 0.7 on the testing set. From these 63 retained models, 74 relations had an associated odds ratio (OR) above 1.9.
Finally, 5 new diseases, 8 new symptoms and 71 new symptom-disease relations were discovered and added to the graph. Interestingly the number of missing nodes and relation in the graph is very low, indicating the huge overlapping between the 2 sources of data.
Graph ML was used to create embeddings of graph nodes and compute patient representations. Following embedding optimisation, several hyperparameters of the fast random projection (FRP) algorithm27 were optimised, using a grid search over the size of the embeddings. Although the optimization showed a slightly better f1-score on the test set with 512 dimensions compared to 256 (0.91 against 0.89), for computational reasons, 256-dimension vectors were used for patient representations.
Patient endotyping
Clustering
K-means clustering was performed on AD patients to group them together based on the representation created using graph representation learning. The number of clusters was chosen using the silhouette score, a metric used to evaluate the quality of clusters28. Since a high silhouette score is desirable, the optimal number of clusters is usually chosen when the silhouette score reaches its global maximum. A reasonable number of clusters should also be considered. Therefore, since a peak appears at k = 7 (silhouette score = 0.22), the number of clusters was chosen to be 7 (Fig. 5).

Silhouette score vs. k, the number of clusters. The number of clusters was determined by optimizing the silhouette score, which evaluates the clustering quality. Typically, the number of clusters is chosen when the silhouette score reaches its global maximum, while ensuring a reasonable number of clusters. Thus, the number of clusters was chosen so that k = 7 was reached for a silhouette score of 0.22.
The silhouette score was also computed at a cluster level (Figs. 5 and 6). The clusters with most patients (clusters 2, 4 and 6), seemed to be better separated and have a small number of patients with negative scores. On the contrary, the clusters with fewer patients (clusters 0, 1, 3 and 5), contained more patients who could overlap with the other clusters and therefore be represented with negative scores. Overall, when considering that the patients all have AD and therefore a potentially close clinical medical picture, the clustering shows quite high performance in terms of homogeneity and cohesion.

Silhouette score for the various clusters. This silhouette plot shows a measure of how close each patient in a cluster is to patients in other clusters and provides a way of visually assessing parameters such as the number of clusters. This measure has a range of [-1, 1]. Patients with negative silhouette scores are patients that are on average closer to patients in another cluster than to points in its own cluster.
Afterwards, to examine the distribution of patients, projections into two and three dimensions were made using UMAP29 (Fig. 7). Clusters 1, 3, 5 and 6 which can be seen in the centre of the 2D projection (Fig. 7a) and isolated in the 3D projection (Fig. 7c), contain mostly pediatric patients. On the contrary, clusters 0, 2 and 4 (Fig. 7d) gather adult patients, and are located further away from the centre. Interestingly, this representation is in line with the silhouette score, where 2 major clusters appear according to the age of the patient at first AD diagnosis (even if age was not used in the clustering, it does seem to characterize clusters) but these two clusters can be divided to reveal 7 phenotypes that can be linked to current medical knowledge.
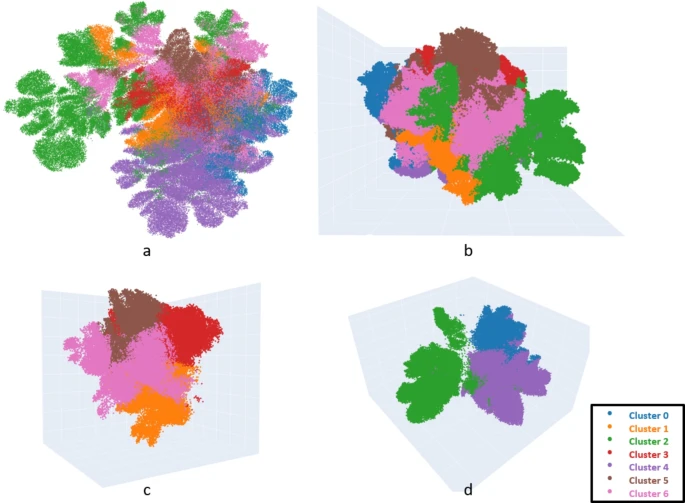
UMAP projections in two dimensions (a) and three dimensions (b, c, d) of all clusters of AD patients. In the 2D projection (Fig. 4a), clusters 1, 3, 5, and 6 are located at the center, while in the 3D projection (Fig. 4c), they appear isolated. These clusters mainly consist of a pediatric population. In contrast, clusters 0, 2, and 4 (Fig. 4d) predominantly comprise adult patients and are positioned farther from the center.
Cluster description
First, age at diagnosis was used to divide the clusters into two broader groups. Additional demographic data was used to describe the patients within each cluster. The first group included mostly children (cluster 1, 3, 5, and 6), with on average their first AD diagnosis before age 15 (Table 2), whereas the second group included mostly adults (clusters 0, 2, and 4), with on average their first AD diagnosis between the ages of 22 and 31 (Table 3).
To provide a comprehensive picture of each cluster, the most characteristic comorbidities were identified (Tables 2 and 3).
Within the four clusters of children, cluster 1 was characterized by a remarkably high prevalence of asthma (93%). This cluster also showed an accumulation of allergic diseases, such as allergic rhinitis (70% compared with 53% in the overall AD population) and hay fever (42% compared with 30% in the overall AD pop).
In cluster 3, the prevalence of candidiasis was high, with 44% for candidiasis of the skin and nails compared to 9% in the overall AD population.
In the remaining two pediatric clusters (cluster 5 and 6), infections were significantly elevated. In cluster 5, the prevalence of infections was remarkably high, with pertussis, diphtheria, and tetanus having a prevalence of 87%, 82% and 80% respectively. In cluster 6, there was a high prevalence of respiratory infections, such as acute pharyngitis (66% compared with 49% in the overall AD population) and acute sinusitis (44% compared with 26% in the overall AD population).
Among the clusters with older patients, cluster 0 was characterized by a high prevalence of diabetes (type not specified) (52% in the cluster compared with 26% in the overall AD population) without an elevated prevalence of type 2 diabetes risk factors, such as obesity (26% compared with 28% in the overall AD population).
In cluster 2, the differences were less marked, and patients were closer to the overall AD population.
The cluster with oldest patients (cluster 4), was characterized by a higher prevalence of cardiovascular diseases, with hypertensive disease having a prevalence of 49% compared with 27% in the overall AD population. The rate of cerebrovascular accidents was remarkably high (61% in the cluster) as well as associated risk factors, such as hyperlipidemia (40% in the cluster compared with 22% in the overall AD population).
Within each cluster, some specific genes were found to be associated with its most characteristic diseases in the knowledge graph. Among these common genes, some were involved in the immune and inflammatory response, in the epidermis structure and in the antioxidant response.
Discussion
In this paper, we propose a novel approach for augmenting RWD and extending ML results with ontological knowledge. EHRs capture high-level phenotypic patient-level data such as diagnoses, procedures, and laboratory measurements. Our proposed methodology augments these data by leveraging a BKG, which contains additional medical knowledge such as disease-symptom interactions and disease-gene interactions. GRL is used to create a joint representation from both RWD and biomedical knowledge for each patient, bridging the gap between individual patient data and a comprehensive patient representation, which can then be used in various precision medicine use cases. On one hand, the new patient representation incorporates biomedical knowledge from the BKG and on the other hand the BKG can also be used for interactive interpretation of patient-level data by exploring relations between medical entities23.
The proposed framework is remarkably flexible and automatable to address multiple precision medicine use cases beyond endotyping. The patient representation created by connecting the EHRs to the BKG could be used in a variety of supervised or unsupervised ML tasks, answering different medical needs such as disease endotype identification, drug repurposing, prognostic factors discovery and disease identification. Interestingly, little feature engineering is required by the method, which saves time and reduces the fastidious nature often associated with studies involving ML. Here, binary vectors capturing patients’ characteristics are directly transformed into patient graph representations, an embedding in which each component carries a portion of the medical signal. Moreover, this study shows the great potential of using multimodal data and GRL to interpret and extend ML results, which is critical for studies at the intersection of ML and medicine. Indeed, we showed that the use of disease-gene links from iBKH23 to identify AD’s endotypes from patient subgroups, can provide a deeper interpretation of the traditional clustering results. It should be noted that the hypotheses generated about endotypes could not have been made using each data source separately. Indeed, the study provided evidence for the identification of coherent subgroups of AD: 4 subgroups were identified in the paediatric population: “Atopic March” (cluster 1), “Candidiasis” (cluster 3), “Early Infections” (cluster 5) and “Infections” (cluster 6), and 3 among adult patients: “Intrinsic AD” (cluster 0), “Comorbid patients” (cluster 4), and “General adult AD” (cluster 2). Two of the most relevant subgroups are described below, and the others are described in the Supplementary Material.
The “Atopic March” subgroup was characterised by a high prevalence in asthma, allergic rhinitis and other allergic diseases, suggesting an atopic march with significant type 2 inflammation30 driven by Th2 cells. All these diseases were associated with genes in the graph linked to the immunologic pathway or involved in the epidermis structure. As the atopic march endotype is also associated with a higher prevalence of the extrinsic AD endotype31, the cluster may represent a subpopulation within the extrinsic AD population possibly interesting to target for treatment.
The “Comorbid patients” subgroup was found to have an increased rate of metabolic diseases such as diabetes, hypertension, and obesity and thus an increased risk of cardiovascular accidents. This group was also characterised by a high number of diseases with an autoimmune aetiology: arthritis, arthralgia, degenerative polyarthritis, and hypothyroidism. Several genes involved in immunologic, and inflammatory systems were linked in the graph to arthritis, cardiovascular diseases and AD, leading to potential new drug targets. Moreover, a gene involved in regulating lipid metabolism was found to affect both heart and bone tissue and was interestingly found associated with AD. The clustering performance and medical coherence were validated by literature and medical experts, and showed promising results, supporting the quality of the patient representations obtained with GRL.
Limitations
The main limitations inherent in this approach primarily stem from the inherent inaccuracies and incompleteness of EHRs and BKGs. The integrated dataset’s completeness of patient information couldn’t be guaranteed, a common challenge associated with EHRs. Moreover, the medical relevance of links between medical entities in iBKH23 could also be subject to questioning.
The ontologies and granularity of the medical vocabularies used in both data sources were crucial for linking them together. The step of mapping one vocabulary to another, necessary to link the two data sources, resulted in a loss of information. For example, in this study, type I and type II diabetes were found distinctly but could not be distinguishable in iBKH23, which may have affected some patient representations. The use of a common vocabulary for both data sources, or a standard vocabulary, could facilitate the linking of both data sources and help to further automate the proposed pipeline.
The clustering and endotyping methods introduced in this study present promising directions for future investigation and enhancement. Given the intrinsic diversity of populations in EHRs, it is imperative to conduct further analyses to ensure the robustness of the clustering approach. While the pursuit of endotypes yields valuable insights, it is important to recognize the challenges associated with drawing causal conclusions regarding the interactions among medical entities and underlying biomechanisms. Looking ahead, the validation of identified subgroups in an independent cohort offers an exciting opportunity for further exploration and validation of our results.
Data availability
The data that support the findings of this study are available from Optum but restrictions apply to the availability of these data, which were used under license for the current study, and so are not publicly available. Data are however available from the first and the corresponding authors upon reasonable request and with permission of Optum.
Abbreviations
- AD:
-
Atopic dermatitis
- BKG:
-
Biomedical knowledge graph
- RWD:
-
Real world data
- EHR:
-
Electronic health record
References
FDA. Available from: https://www.fda.gov/.
Murali, L. et al. Towards electronic health record-based medical knowledge graph construction, completion, and applications: A literature study. J. Biomed. Inform. 143, 104403 (2023).
Zhou, D. et al. Multiview incomplete knowledge graph integration with application to cross-institutional EHR data harmonization. J. Biomed. Inform. 133, 104147 (2022).
Zou, Y. et al. Modeling electronic health record data using an end-to-end knowledge-graph-informed topic model. Sci. Rep. 12(1), 17868 (2022).
Nelson, C. A., Butte, A. J. & Baranzini, S. E. Integrating biomedical research and electronic health records to create knowledge-based biologically meaningful machine-readable embeddings. Nat. Commun. 10(1), 3045 (2019).
Soman, K. et al. Early detection of Parkinson’s disease through enriching the electronic health record using a biomedical knowledge graph. Front. Med. (Lausanne) 10, 1081087 (2023).
Simpson, E. L. et al. Two phase 3 trials of dupilumab versus placebo in atopic dermatitis. N. Engl. J. Med. 375(24), 2335–2348 (2016).
Ujiie, H. et al. Unmet medical needs in chronic, non-communicable inflammatory skin diseases. Front. Med. (Lausanne) 9, 875492 (2022).
Finngen. Available from: www.finngen.fi.
Biobank, U. Available from: www.ukbiobank.ac.uk.
Fecho, K. et al. A biomedical knowledge graph system to propose mechanistic hypotheses for real-world environmental health observations: Cohort study and informatics application. JMIR Med. Inform. 9(7), e26714 (2021).
Santos, A. et al. A knowledge graph to interpret clinical proteomics data. Nat. Biotechnol. 40(5), 692–702 (2022).
Zhu, Y. et al. Drug knowledge bases and their applications in biomedical informatics research. Brief Bioinform. 20(4), 1308–1321 (2019).
Chandak, P., Huang, K. & Zitnik, M. Building a knowledge graph to enable precision medicine. Sci. Data 10(1), 67 (2023).
Boudin, M. et al. The OREGANO knowledge graph for computational drug repurposing. Sci. Data 10(1), 871 (2023).
Wu, Z. et al. HALD, a human aging and longevity knowledge graph for precision gerontology and geroscience analyses. Sci. Data 10(1), 851 (2023).
Putman, T. E. et al. The monarch initiative in 2024: An analytic platform integrating phenotypes, genes and diseases across species. Nucleic Acids Res. 52(D1), D938–D949 (2024).
Su, C. et al. Biomedical discovery through the integrative biomedical knowledge hub (iBKH). iScience 26(4), 106460 (2023).
Qiagen. Available from: https://www.qiagen.com/.
Exscientia. Available from: https://www.exscientia.ai/.
Insilico. Available from: https://insilico.com/.
Optum. Humedica de-identified EHR dataset 2022.
Su, C., et al. Biomedical discovery through the integrative biomedical knowledge hub (iBKH). iScience (2021).
Technology, I. Neo4j, the World’s Leading Graph Database (Neo4j Graph Database, 2015).
Bodenreider, O. The unified medical language system (UMLS): Integrating biomedical terminology. Nucleic Acids Res. (2004).
Rotmensch, M. et al. Learning a health knowledge graph from electronic medical records. Sci. Rep. 7(1), 5994 (2017).
Chen, H. Fast and accurate network embeddings via very sparse random projection (2019).
Shahapure, K. R. & Nicholas, C. Cluster quality analysis using silhouette score. In IEEE 7th International Conference on Data Science and Advanced Analytics (DSAA) (2020).
McInnes, L., Healy, J. & Melville, J. UMAP: Uniform manifold approximation and projection for dimension reduction. aXiv (2020).
Tsuge, M., et al. Current insights into atopic march (2021).
Tokura, Y., Hayano, S. Subtypes of Atopic Dermatitis: From Phenotype to Endotype (Allergology International, 2022).
Acknowledgements
We thank Jennifer Wong (Global Head DDS Strategy & Business Transformation at Sanofi) and Dr Tristan Fauvel (Senior Data Scientist at Quinten) for reading and revising the manuscript.
Author information
Authors and Affiliations
Contributions
F.F. and F.A. conceived the project.F.F, F.A, P.L., M.T, N.T, J.C and MM designed the analyses.P.L., M.T, N.T, J.C and MM performed the analyses.F.F, F.A, P.L., M.T, N.T, J.C and MM, interpreted the results and wrote the manuscript.
Corresponding author
Ethics declarations
Competing interests
FF, FA and MM are Sanofi employees and may hold shares and/or stock options in the company.PL, MT, NT and JC has no competing interests.
Additional information
Publisher’s note
Springer Nature remains neutral with regard to jurisdictional claims in published maps and institutional affiliations.
Electronic supplementary material
Below is the link to the electronic supplementary material.
Rights and permissions
Open Access This article is licensed under a Creative Commons Attribution-NonCommercial-NoDerivatives 4.0 International License, which permits any non-commercial use, sharing, distribution and reproduction in any medium or format, as long as you give appropriate credit to the original author(s) and the source, provide a link to the Creative Commons licence, and indicate if you modified the licensed material. You do not have permission under this licence to share adapted material derived from this article or parts of it. The images or other third party material in this article are included in the article’s Creative Commons licence, unless indicated otherwise in a credit line to the material. If material is not included in the article’s Creative Commons licence and your intended use is not permitted by statutory regulation or exceeds the permitted use, you will need to obtain permission directly from the copyright holder. To view a copy of this licence, visit http://creativecommons.org/licenses/by-nc-nd/4.0/.
About this article

Cite this article
Frau, F., Loustalot, P., Törnqvist, M. et al. Connecting electronic health records to a biomedical knowledge graph to link clinical phenotypes and molecular endotypes in atopic dermatitis. Sci Rep 15, 3082 (2025). https://doi.org/10.1038/s41598-024-78794-5
Received:
Accepted:
Published:
Version of record:
DOI: https://doi.org/10.1038/s41598-024-78794-5
