
Abstract
There is a great discrepancy between the clinical categorization of MEFV gene variants and in silico tool predictions. In this study, we developed a seven-tier classification system for MEFV missense variants of unknown significance and recommended a generalized pipeline for other gene classifications. We extracted 12,017 human MEFV gene variants from the Ensembl database. After extraction, we detected 6034 missense variants. In the next step, we selected 42 in silico tools for our classification model. We determined the optimal value via the scores from three in silico tools. For the implementation of machine learning methods, we used two bagging methods and two boosting methods. After predicting known variants, we applied our model to 5507 variants of unknown significance. In the final stage, we applied the developed framework to the entire dataset to rigorously evaluate its classification performance and validate its potential clinical utility. The XGBoost model achieved the highest accuracy at 0.9882 (± 0.0295), followed by Extremely Randomized Trees (0.9835 ± 0.0335), Random Forest (0.9788 ± 0.0158), and AdaBoost (0.9671 ± 0.0815). Following the refinement of the dataset and the introduction of a novel classification and clustering methodology, the proportion of known variants increased from 6.9 to 29.4%, marking a 4.3-fold relative improvement. Furthermore, we identified two novel hotspot regions and one tolerant site, offering valuable insights into the functional structure of the pyrin protein. Rigid and adaptive classifiers offer an innovative framework for VOUS classification, integrating a grayscale interpretation system with cutting-edge in silico tools and machine learning algorithms. This approach not only improves the accuracy of MEFV gene variant classification but also identifies new hotspot regions for functional studies, paving the way for scalable applications to other genes and might contribute to advancing precision genomic medicine in the future.
Introduction
Familial mediterranean fever (FMF) is an autoinflammatory disease that manifests through attacks of fever, abdominal pain, and polyserositis and is associated with mutations in the MEFV gene that encodes the 781 amino acid pyrin protein that functions as a regulator of the innate immune system1. The mutated pyrin is less phosphorylated, and this leads to increased inflammasome formation and inflammation. This complex mutational spectrum is closer to the conventional diagnostic criteria than to other spectra, and it is important to distinguish between these conditions and autoimmune conditions for effective clinical decision-making2. Next-generation sequencing has helped to improve the diagnosis of FMF and has identified many new MEFV mutations, but more than half of the mutations are classified as variants of uncertain significance (VOUS) according to the International Study Group on Systemic Autoinflammatory Disorders (INSAID)3.
Gene-specific variant predictor optimization studies have demonstrated beneficial outcomes for improving variant estimation4,5,6. This is endorsed by the American College of Medical Genetics and ClinGen, which recommend that evaluating these tools on a variant and gene-specific basis yields more advantageous results7,8. They provided a set of recommendations aimed at improving classification accuracy by emphasizing gene-specific assessments. Therefore, several optimization strategies have been proposed. However, these recommendations do not guarantee optimal outcomes for autoinflammatory diseases characterized by complex mechanisms, such as Familial mediterranean fever (FMF). Furthermore, owing to the prevalence of complex mechanisms, variants that are scored and trained on a gene-specific basis often include significant outliers, which have not been sufficiently addressed9,10. Local outlier factor (LOF) analysis can help in identifying rare or anomalous MEFV innate immunity regulator, pyrin (MEFV) ,variants that deviate from the norm, whereas ensemble machine learning algorithms can provide a robust and accurate predictive model by combining the strengths of multiple learning algorithms11.
Despite the continuous discovery of new in silico tools, their ability to accurately predict the effects of detected variants on protein function remains suboptimal12. The discriminatory capacity of these tools is particularly inadequate for genes such as MEFV, where gain-of-function mechanisms predominate. Studies have shown that even the best scoring systems for rare variant detection, such as Rare Exome Variant Ensemble Learner (REVEL), fail to provide the desired predictions for variants in this gene. Many in silico predictors are trained via traditional machine learning algorithms such as logistic regression, support vector machines, and naïve Bayes13,14. The predictive power of existing tools can be enhanced to approach the desired level through the optimized application of both boosting and bagging methods. Ensemble machine learning algorithms, by employing these techniques, can effectively address the challenges of balancing bias and variance15,16.
The field of personalized medicine increasingly recognizes the limitations of universal predictive tools in genetic analysis. Given the inherent uniqueness of individual genomes, a one-size-fits-all approach may not be suitable, particularly for genes associated with complex diseases. This underscores the need for gene-specific pipelines that leverage the most informative in silico tools for accurate variant interpretation17. While such pipelines can serve as models for other genes, the selection and optimization of tools should be tailored to each gene’s specific characteristics and associated disease phenotypes.
This principle is particularly relevant for VOUS classification7,8,9,17. Many existing in silico tools rely on a binary classification system (benign/pathogenic), which fails to capture the spectrum of uncertainty inherent in VOUS interpretation. While some tools offer an “indeterminate” category18, this designation often lacks the granularity needed for nuanced clinical decision-making12. A more informative approach would involve classifying VOUS into an ordinal scale, providing a descriptive measure of their likelihood of pathogenicity.
This study aims to increase the prediction accuracy of MEFV gene variant pathogenicity, with a particular focus on classifying variants of uncertain significance into an ordinal scale of pathogenic likelihood. Furthermore, this study also aimed to predict alternative hotspot regions for future research. This goal will be achieved through the development and refinement of novel computational algorithms. By achieving greater accuracy of predictive power, this research endeavors to establish a robust knowledge base that can significantly clarify therapeutic strategies and prognostic assessments for patients with associated autoinflammatory disorders. The proposed approach involves rigorous validation via a comprehensive dataset of known pathogenic and benign MEFV variants. Ultimately, this study has the potential to provide crucial insights into the complexities of MEFV gene behavior, offering a valuable tool for both clinicians and researchers specializing in the field of autoinflammatory disease. Moreover, this methodology can be easily adapted to other genes.
Material methods
Variable selection and feature engineering
Variant extraction and determination of the training dataset
Ensembl is an open-source bioinformatics project designed to organize biological data systematically, focusing on the sequences of large-scale genomes. It offers a robust platform for the automatic annotation of individual genomes, as well as the determination of synteny and orthology relationships between them. The Ensembl database is publicly available at https://www.ensembl.org and adheres to relevant guidelines and regulations. No ethical approval or informed consent is required for data obtained from this public database. It consists of more than 20,000,000 gene variants19.
Our flowchart of the study is shown in Fig. 1. We extracted 12,017 MEFV gene variants from the Ensembl database (https://www.ensembl.org/, data accession date: 07/08/2023). After extraction, we detected 6034 missense variants. Since ClinVar classifications encompass multiple categories, we consolidated them under a simplified classification scheme (Table 1).

The flowchart illustrating the novel methodology for classifying MEFV gene variants.
Grouping seventeen clinvar classifications into three main categories
Inıtially, we merged benign, benign ~ likely benign, likely benign, not provided ~ benign, uncertain significance ~ benign, uncertain significance ~ benign ~ likely benign, uncertain significance ~ likely benign variants as likely benign (LB) (n = 279) variants and uncertain significance ~ likely pathogenic ~ pathogenic, likely pathogenic ~ pathogenic, pathogenic, pathogenic, and uncertain significance ~ pathogenic variants as likely pathogenic (LP) (n = 133) variants. Overall, 412 variants were obtained for the training dataset. The same methodology was previously implemented for several studies9,17,20. Furthermore, according to ACMG classification systems, VOUS variants can be assessed as “VOUS ~ LP”, which is most likely “LP”, or “VOUS ~ LB”, which is most likely “LB”.
Normality check and data transformation
Normality was assessed using normality tests (Kolmogorov-Smirnov, Shapiro-Wilk and Anderson-Darling tests), Q-Q plots, skewness and kurtosis. LP and LB variant pathogenicity scores were assessed independently. For normal distribution skewness and kurtosis should be zero (standardized kurtosis) or between ± 2 which are the common thresholds used in statistics21,22,23,24. When the p-value was less than 0.05 in normality tests or normality was violated, data transformation was used. The criteria for the choice of the proper transformation method are outlined in Supplementary File 1, and the properties of each method and the recommended application are also provided in the same25,26,27.We utilized LOF analysis to exclude outliers. The LOF algorithm is described in reference to the utilization of density-based techniques28.Detailed implementation of LOF analysis were presented in Supplementary File 2.
Feature selection
While choosing in silico tools, we assessed various factors. Initially, we selected in silico tools due to their currency, validation, and endorsement by the Clingen Group, ACMG and Association for Clinical Genomic Science (ACGS). In 2022, ClinGen assessed the accuracy of 13 computational tools specifically developed for forecasting the pathogenicity of genetic variants. The evaluation was conducted via the scoring mechanisms of the tools themselves and updated criteria for PP3/BP4, which included new recommendations. However, many more tools have been developed, and current tools are suggested to discriminate better classifications. Although many novel newly developed tools have not been validated on the Clingen list, we included more than 50 tools overall for our analysis, including Varity, Eve, and alphamissense18. We implemented the recursive feature elimination (RFE) method for feature selection. While implementing RFE, we used random forest (RF) as a machine learning method.
Machine learning model building
We determined the following supervised machine learning methods to predict classification for this study, as indicated in Table 2. However, our data are not normally distributed after outlier removal and data transformation methods, and we implemented only four robust machine learning methods: RF, AdaBoost, XGBoost, and EXTC. We used the best hyperparameters after hyperparameter tuning. For cross-validation, we tested k-fold cross-validation, hold-out cross-validation, stratified k-fold cross-validation, leave-p-out cross-validation, and leave-one-out cross-validation. When implementing cross-validation techniques, we opted for Grid Search CV over Randomized Search CV, as it yields more accurate results, despite its drawback of requiring more time during the search process. The final model evaluation was based on soft, hard, and hybrid voting classification methods.
Rigid and adaptive classifiers
Finally, we integrated our innovative methods, including rigid and adaptive classifiers, into the VOUS variants (Fig. 2). According to our novel approach, we evaluated VOUS variants in three categories: VOUS neutral (VOUS0), VOUS first-tier (VOUS+, VOUS-), and VOUS second-tier (VOUS++, VOUS--). Adaptive classifiers evaluated VOUS first-tier and second-tier variants as LB and LP variants, while VOUS0 variants remained in an indeterminate category; rigid classifiers only classified second-tier variants as LB and LP variants.

Rigid and Adaptive Classifiers. The classification process is determined by a hard voting classifier. The 7-tier new classification system and the 5-tier VOUS variants were used. Seven-tier ordinary classification system: LB, VOUS--, VOUS-, VOUS, VOUS+, and VOUS++, LP respectively. The adaptive classifier distributes both first-tier and second-tier VOUSs as LB (VOUS-, VOUS--) and LP (VOUS+, VOUS++), while the VOUS0 variants are considered ambiguous. The rigid classifier is more rigid and only distributes second-tier VOUSs as LB (VOUS--) and LP (VOUS++). It maintains a wider VOUS secure zone (VOUS-, VOUS0, VOUS+).
Statistical analysis
Both discrete and continuous numerical variables were evaluated for their adherence to a normal distribution. Where assumptions of normality were met, calculations of means and standard deviations were implemented. In the absence of a normal distribution, medians and interquartile ranges were used instead. All categorical variables, irrespective of being nominal or ordinal, were quantified and expressed as percentages. Furthermore, ordinal variables were organized hierarchically. To verify normality, both graphical and statistical methods were applied. The outliers were identified and removed via local outlier factor analysis. To verify normality, an analysis of variance (ANOVA) was subsequently performed on normally distributed data. Post-ANOVA, a Tukey test was conducted for post hoc analysis. For data not conforming to a normal distribution, a Kruskal‒Wallis H test was performed, followed by a Dunn‒Bonferroni correction for post hoc evaluation. The confidence interval for all the statistical tests was set at 95%, with alpha (α) and beta (β) levels established at 0.05 and 0.20, respectively. A significance level of 0.05 was designated for p values, with values below this threshold deemed statistically significant.
Results
Exploratory data analysis
First, to evaluate feature relationships, we assessed 42 scores using Spearman correlations within three categories—LB, VOUS, and LP (Fig. 3A–C). Second, we applied principal component analysis (PCA) across 42 in silico tools, revealing that two principal components can explain 84% of the variance (Fig. 3D). Next, we selected the performance metric for LB and LP variant prediction. We identified the dataset as unbalanced and selected the F1 score as the performance metric (Fig. 3E).

Feature selection steps in the application of machine learning algorithms. Subfigures (A), (B), and (C) display Spearman correlation heatmaps for the LB, VOUS, and LP variants, respectively. Subfigure (D) illustrates the results of principal component analysis (PCA) applied across 42 in silico tools, revealing that the accessible in silico tools can be explained with two or three components. PC1 explains 60% of the variance, PC2 explains 24%, and PC3 explains 4% of the variance, together they account for 88% of the total variance. The elbow plot analysis suggests that using two components is more appropriate than three, as the additional component provides minimal improvement in clustering performance. (E) This classification system was further utilized to assess the distribution of amino acid positions. (F) The method employed for feature selection is recursive feature elimination with cross-validation (RFECV), which identifies six in silico tools as the optimal feature set for precise variant classification. The results underscore the effectiveness of these tools in distinguishing between different variant categories. (G) Feature importance metrics based on RF algorithm. Revel displayed outperformed performance than other scores. Determination of optimum number of clusters according to the Elbow Method (H) and Silhouette Scores (I). According to elbow method and Silhouette scores 3 number of clusters showed best overall performance (J) 3-means clustering results: Revel(First cluster), Mutation Assesor, MetaLR (Second cluster), CADD, SIFT, Polyphen-2 (Third Cluster). (Hyperparameters: n_clusters=[2, 3, 4, 5], init=’k-means++’, n_init = 10, max_iter = 300, tol = 1e−4, distance_metric=’euclidean’, random_state = 42, verbose = 0, algorithm=’lloyd’). Subfigures (K), (L), and (M), present the Spearman correlation analysis between LP, LB, overall (LP + LB) conducted on the top six selected in silico tools. The performance of the classification models is evaluated via F1 metrics, with the corresponding F1 scores displayed in subfigure. According to the RFECV scores and PCA, three in silico tools represent the optimum number of features. (N) The classifier’s performance was evaluated using RFECV and obtained the highest results with three features.
Feature selection
Feature selection is usually divided into three categories, namely filter, embedded, and wrapper methods. In our analysis, we applied these three techniques using the appropriate approach depending on the nature of the data that was given to us. For the filter method, we ranked features according to their correlation coefficients. For the embedded method, we used feature importance measures computed from a random forest model. Lastly, for the wrapper method, we used Recursive Feature Elimination with Cross-Validation (RFECV).
Determining the optimal number of features for machine learning models
In the fourth step, we use RFECV to test how many features the model can achieve the highest level of success with. For this purpose, we used the random forest method, which is relatively more sensitive to outliers than linear methods are. For this purpose, we included 42 in silico tools in a model. We imputed all missing values using tree-based methods29. We determined that the optimal feature was three or six in silico tools (Fig. 3F) (Table 3). We calculated feature importance metrics for six features using the Random Forest algorithm. Based on these metrics, we derived the REVEL, SIFT, PolyPhen-2, MetaLR, CADD, and Mutation Assessor scores (Fig. 3G). To evaluate whether these features could be utilized more effectively, we decided to perform k-means clustering analysis. We initially determined the ideal number of clusters for this purpose by calculating the Elbow Method (Fig. 3H) and Silhouette Scores (Fig. 3I). The analyses indicated that three clusters were optimal. The clustering analysis identified REVEL as a unique cluster, MetaLR, and Mutation Assessor in the second cluster, and CADD, SIFT, and PolyPhen-2 in the third cluster (Fig. 3J). Furthermore, we noted high correlations among features within identical clusters (The clustering evaluation metrics were as follows: Silhouette Score = 0.56, Davies-Bouldin Index = 0.44, and ANOVA (F = 24.07, p = 0.014). Welch t-test revealed the following results: Cluster 0 vs. Cluster 1 (t = − 3.30, p = 0.183), Cluster 0 versus Cluster 2 (t = − 12.49, p = 0.041), and Cluster 1 vs. Cluster 2 (t = − 2.72, p = 0.156), indicating significant differences only between Cluster 0 and Cluster 2).
It is therefore important to remove features that are highly correlated as they are more likely to cause overfitting as pointed out by prior studies9,12,30,31. To this end, we conducted Spearman correlation analysis of all six features and found that some scores were highly correlated (r > 0.7)17,30,32,33 (Fig. 3K–M). After the RFECV, RFE, clustering analysis and correlation analysis, we have decided to reduce model feature numbers to obtain more optimum results. For this purpose, we decided to perform an analysis in such a way that one algorithm is selected from each cluster. We then performed the RFECV analysis again using RF (Fig. 3N). The model obtained similar performance metrics using three features in a shorter amount of time compared to using six features. We detected a noticeable improvement of 0.057 s (Table 2).
Feature selection steps
REVEL demonstrated significantly higher feature importance compared to other scores. MetaLR also outperformed Mutation Assessor in terms of feature importance. The previously described method imputed 42 missing values from Mutation Assessor, whereas MetaLR had no missing data. Furthermore, we observed a strong correlation between MetaLR and Mutation Assessor. These findings led us to choose MetaLR as the second feature for our model. Although the decision between MetaLR and Mutation Assessor was straightforward, selecting the third score was more challenging. PolyPhen-2, despite having a lower impact compared to other features, exhibited an influence level significantly below that of the first two scores. However, while CADD showed relatively higher feature importance than SIFT, the inherent negative correlation model in SIFT’s algorithm provided a safeguard against overfitting. To address these complexities, we decided to test all six possible combinations of the four scores using machine learning models without any preprocessing.
We looked at different three-feature combinations in the random forest model, including REVEL + MetaLR + Mutation Assessor, REVEL + MetaLR + CADD, REVEL + MetaLR + PolyPhen-2, and REVEL + MetaLR + SIFT. We found that REVEL and MetaLR were the two most important features in all of them. However, since the third feature varied across models, we opted not to rely solely on a model specific to the random forest algorithm. To address this, we tested all three-feature models across six machine learning algorithms and selected the combination with the smallest differences in F1 metrics. For these six algorithms, we chose three boosting methods, two bagging methods, and one linear method. The inclusion of a linear method allowed us to evaluate whether the chosen combination performed similarly in linear models. This approach ultimately led us to select SIFT as the third feature (Table 4). Had we relied solely on the random forest algorithm, we would have selected CADD as the third score. Consequently, we would have missed the combination with SIFT, which demonstrated relatively better performance in linear models (Supplementary Table 1).
Feature engineering
We detected 412 known MEFV gene variants in total. First, we checked our variants to detect the distribution type. Following this procedure, we removed from the model the 15 of 20 (75%) variants that were already known1 and determined them by ClinVar’s two-star reviewer status. The motivation for not removing all 23 identified two-star variants was to maintain equilibrium between the LB and LP variants. There were only 7 LB/B (30.44%) variants, but there were 16 LP/P (69.46%) variants (https://www.ncbi.nlm.nih.gov/clinvar). We did this to set them aside for testing the prediction performance of the model. Overall, 397 variants remained. The data, from both LP and LB variants, did not show a normal distribution based on the results of the Shapiro-Wilk, Anderson-Darling, and Kolmogorov-Smirnov tests in all three in silico tools (p < 0.001). Therefore, we performed log-scaled transformation for all the scores (Fig. 4A–C). However, the distribution was not altered (Fig. 4D). In this case, we opted to use a multivariate outlier analysis method. However, before proceeding, we considered evaluating the impact of outliers on the model using SHAP values. Completely removing these outliers could have resulted in a significant loss, both biologically and statistically, especially for Revel and MetaLR (Fig. 4F–G). Upon examining the dataset, it became clear that outliers varied across different scores. Therefore, a method capable of assessing these outliers in a multivariate context was required. In the next step, we implement multivariate outlier detection methods. We conducted LOF analysis on the basis of the optimal values of the hyperparameters. While conducting the analysis, we ensured there was no contamination and optimized the hyperparameters to retain as much data as possible while removing extreme outliers (n_neighbors = 20, contamination = 0.1, metric=’minkowski’, leaf_size = 20, p = 5); outlier_mask = lof.fit_predict(X) != -1). We were aware that this process might lead to the loss of biologically significant variants during model training. Therefore, while applying the LOF analysis, we focused on three important aspects: (1) We tested the best combinations for LOF analysis by optimizing all neighborhood sizes and contamination levels through hyperparameter tuning and used outlier thresholds of -1, -2, and − 3. Another potential approach could have been to reweigh the outliers. We compared the results of applying, weighting, and not applying LOF and found that removing outliers produced the best combination for LOF (Table 5). As a result, we identified 5 extreme values and eliminated 23 outliers from the study. Overall, after performing local outlier factor analysis, we obtained 369 variants (Fig. 4E). The SHAP analysis revealed that MetaLR had the largest contribution to the model’s predictions (-0.33), influencing outputs in a negative direction. In contrast, Revel (0.06) and SIFT (0.03) contributed positively, albeit minimally (Fig. 4F–H). While SHAP values indicated MetaLR’s dominant influence, other feature importance analyses identified Revel as the most significant feature overall, contributing to approximately half of the model’s predictive power (Fig. 4I).

Feature Engineering Steps in the Application of Machine Learning Algorithms. Subfigures (A), (B), and (C) present the log-transformed distributions and Q‒Q plots of the REVEL, MetaLR, and SIFT scores, respectively. For each subfigure, the left panels depict the log-transformed distributions, whereas the right panels present the corresponding Q‒Q plots. Subfigure (D) shows the combined density plots for the selected in silico tools, where nonnormal distributions persist even after data transformation (E). The 3D scatter plot (E) provides a visual representation of the local outlier factor (LOF) analysis, identifying and highlighting the 28 outliers that were subsequently excluded from the study. Subfigure (F) presents a heatmap of SHAP values, illustrating the impact of each feature on model predictions across instances. The dot plot in (G) further elaborates on the feature impacts, whereas subfigure (H) offers a summary plot of SHAP values, demonstrating the combined influence of the top features within the triple in silico tool model. Notably, MetaLR has a substantial negative effect on the model’s output. Finally, in subfigure (I), the feature importance metrics reveal that REVEL is the most significant contributor, accounting for approximately half of the model’s predictive power.
Model building and validation
After these steps, we implement training, validation, and test datasets into an ensemble classification dataset. We obtained better 10-fold cross-validation results. We analyzed known variants in two datasets: the training dataset (n = 291) and the test dataset (n = 78) after the outlier detection step. After implementing the machine learning algorithm, we conducted hyperparameter tuning for our accurate machine learning classifier algorithms (Supplementary Table 2). After hyperparameter tuning, the XGBoost and ExTC algorithms both displayed nearly perfect performance (Supplementary Table 3). Accordingly, all three voting classifiers, ExTC and AdaBoost, performed with perfect classification accuracy. However, we detected XGBoost and RF with relatively low precision scores. We tested the model’s prediction accuracy on 15 previously known ClinVar variants. The model correctly classified all 15 known variants via the hard, soft, and hybrid voting classifier methods (100%) (Fig. 5). Supplementary Tables 4 and 5 display the performance metrics of the remaining supervised machine learning models on both raw and preprocessed data, respectively. Among them, the LGBM classifier, label propagation, and bagging classifier indicated superior performance compared to other models. Surprisingly, the LGBM model demonstrated better performance metrics compared to XGBoost. In this context, we might be using the LGBM classifier instead of XGBoost. However, the study design phase is unlikely to predict such an outcome, as XGBoost typically favors relatively smaller datasets, while LGBM typically handles larger datasets. In this regard, the selection of XGBoost for the current dataset remains a more reasonable choice.

Evaluation metrics and performance comparison of different machine learning models employed in the classification of MEFV gene variants. Every subfigure provides detailed information about different aspects of the model’s training, validation, and performance. Visual representation of the learning curves, discrimination thresholds for each model, precision‒recall tradeoff, and class prediction error of all four algorithms (RF, ExTC, AdaBoost, and XGBoost). Accuracy metrics of all four algorithms with 5-fold cross-validation and hold-out methods: RF: 0.9788 ± 0.0158, ExTC: 0.9835 ± 0.0335, XGBoost: 0.9882 ± 0.0295, AdaBoost: 0.9671 ± 0.0815. Best hyperparameters for RF {max_depth’: 20, ‘min_samples_leaf’: 1, ‘min_samples_split’: 5, ‘n_estimators’: 200}, Best hyperparameters for ExTC: {‘max_depth’: 20, ‘min_samples_ leaf’: 1, ‘min_samples_split’: 2, ‘n_estimators’: 100}, Best hyperparameters for XGBoost: {‘learning_rate’: 0.1, ‘max_depth’: 5, ‘n_estimators’: 100}, Best hyperparameters for AdaBoost: {‘learning_rate’: 1, ‘n_estimators’: 200}
Model prediction of variations in unknown significance variants
The adaptive classifier classified 95.39% of VOUS variants, including both first-tier and second-tier categories, as LP or LB categories. Of these, 4.61% were classified as VOUS0 which means that they were not assigned to any category. On the other hand, the rigid classisfier was able to classify 64.78% of the second-tier VOUS variants. Still, 35.22% of the VOUS variants couldn’t be assigned to any of the categories in rigid classification system.
Clustering analysis
Method selection
We used distance-based methods for clustering analysis. Specifically, we employed agglomerative hierarchical clustering among distance-based methods and k-means among partitional clustering34. We chose hierarchical clustering because we wanted to determine the optimal number of clusters in the 7-tier classification, which is based on an ordinal classification system, and to identify distances between clusters. For this analysis, we used Ward’s distance. We opted for a hard (strict) clustering algorithm instead of a fuzzy clustering algorithm to reduce the uncertainties that can arise with fuzzy clustering and to ensure that each variant belongs to exactly one cluster.
Application
We applied clustering analyses to three groups of data:
-
1.
A dataset obtained by simplifying the ClinVar dataset and producing a 7-tier classification.
-
2.
A dataset in which 1st-tier variants are considered LB (likely benign) and LP (likely pathogenic) as indicated by the Rigid Classifier.
-
3.
A dataset in which both 1st-tier and 2nd-tier VOUS (variants of uncertain significance) are considered LB and LP, as specified by the Adaptive Classifier.
Motivation
Our goal in the first phase was to determine into which groups the 7-tier classifier distributes the data and to assess the extent to which it reduces uncertainty. In the second phase, we aimed to identify which classifier—rigid or adaptive—could provide better separation metrics when VOUS variants are subdivided. We sought to adapt the results of the 7-tier classifier to both rigid and adaptive classifiers to see which models show alignment with clustering analyses performed without labels (Fig. 6)28,35,36,37,38.

Flowchart of clustering methods.
With this objective, we first set out to determine the optimal number of clusters for both the k-means and hierarchical clustering algorithms. Accordingly, out of the 22 methods used for hierarchical clustering, 9 (41%) identified 3 as the optimal number of clusters, and out of the 29 methods used for k-means, 11 (39%) also identified 3 as the optimal number of clusters39,40,41 (Supplementary Tables 6 and 7, respectively). In the next step, we performed both k-means and hierarchical clustering and compared the distributions in these clusters. These analyses are presented in Figs. 7 and 8, respectively.

K-means Clustering Results (A) Overall distribution of the dataset obtained via the 3-means (K-means) clustering method; (B) distribution of the 412 known variants. (C,D) In the K-means analysis, Cluster 3 is designated as the LP variant–dominant cluster and Cluster 2 as the LB variant–dominant cluster, while Cluster 1 lacks a distinct group-specific distribution pattern and is thus classified as the VOUS cluster irrespective of variant counts or percentages. (E–H) Similarly, the hierarchical clustering approach applied to the same dataset produced comparable distribution patterns. In a subsequent analysis, variant distributions were further examined using both rigid and adaptive classifiers; notably, the application of the adaptive classifier enhanced intra-cluster homogeneity and reduced inter-cluster heterogeneity.

Hierarchical clustering Results. (A) Overall distribution obtained using hierarchical clustering analysis (n = 3). (B) Distribution of the 412 known variants. (C,D) In the analysis, Cluster 1 was found to be dominated by LP variants, whereas Cluster 2 primarily comprised LB variants. Cluster 3 did not exhibit any distinct group-specific distribution in terms of either the number or proportion of variants and is thus defined as the VOUS cluster. (E–H) In a subsequent evaluation, variant distributions were analyzed using both rigid and adaptive classifier approaches; the adaptive classifier approach was observed to enhance intra-cluster homogeneity while diminishing inter-cluster heterogeneity.
Interpretation of results
K-means clustering
According to the results of the 7-tier classification, the third cluster mainly contained LP, VOUS++, and VOUS + variants (95.6% of third cluster). In this classification, only a small number of LB variants were identified in the third cluster, making it the cluster with the fewest LB variants (2.3% of third cluster); moreover, it contained only four VOUS--, and VOUS- variants (0.5% in third cluster). Meanwhile, the second cluster included LB, VOUS–, and VOUS–– variants (89.3% of third cluster). It contained only a limited number of LP variants (3.7% of third cluster). Hence, the first two clusters showed a clear separation in terms of classification. Therefore, we labeled the third cluster as the LP variant cluster and the second cluster as the LB variant cluster. Another important reason for this labeling was that all two-star LP/P variants from ClinVar were located in the first cluster, whereas the remaining LB/B variants were located in the second cluster (Fig. 7C,D).
However, the first cluster did not exhibit a distinct pattern based on variant types. Altogether, the second and third clusters contained a substantial portion of the total variants. If we assume that 35 variants (2.8% off all variants) in the third cluster (LP variant cluster) and 45 variants (4.3% of all variants) in the second cluster (LB variant cluster) were incorrectly assigned, then 1796 variants (a 29.35% out of all variants) could be considered properly clustered compatible with group names. By comparison, the simplified Clinvar dataset which we prepared for supervised learning (7-tier classification dataset) classifies a much smaller fraction of all variants (assumed 412 variants, confirmed 23 variants). Therefore, the k-means approach increased the number of assumed “known” variants by 412%.
Furthermore, when the known LB and LP variants (412 variants) were clustered into three groups, none of the clusters showed a statistically significant distribution (p > 0.05). In contrast, the 7-tier classification system enabled a more distinct clustering-based separation of LB and LP variants. After establishing that this separation occurs in such a manner, the next step was to determine the cutoff point for VOUS variants in the 7-tier classifier. For this, we used both rigid and adaptive classifiers(Fig. 7E–H). Under the adaptive classifier, the third cluster in the k-means analysis contained a high percentage (e.g., ~ 95.6%) of LP variants, whereas the second cluster contained a similarly high percentage (e.g., ~ 89.3%) of LB variants (Fig. 7G,H). Thus, both clusters achieved statistically significant separation (p < 0.001 for each). In the third cluster, the significant difference was driven by LP variants; in the second cluster, by LB variants. The rigid classifier, similar to the adaptive classifier, also significantly separated the second and third clusters (p < 0.001 for both).
Hierarchical clustering
According to the results of the 7-tier classification, the first cluster mainly contained LP, VOUS++, and VOUS + variants. In this classification, only 19 LB variants were identified, representing the cluster with the fewest LB variants; additionally, this cluster contained no VOUS– – or VOUS– variants. Meanwhile, the second cluster mainly contained LB, VOUS–, and VOUS–– variants. This cluster included only 29 LP variants and did not include any VOUS + or VOUS + + variants. Hence, the first two clusters showed a clear separation in terms of classification (Fig. 8C,D). Therefore, we labeled the first cluster as the LP variant cluster and the second cluster as the LB variant cluster. Another important reason for this decision was that all 16 LP/P variants with two-star ratings in ClinVar were located in the first cluster, while the other 7 LB/B variants were located in the second cluster.
However, the third cluster did not exhibit a distinct pattern based on variant types. Altogether, the first and second clusters contained 1,079 variants. If we assume that the 19 LB variants in the first cluster (LP variant cluster) and the 29 LP variants in the second cluster (LB variant cluster) were incorrectly assigned, then a total of 1,041 variants (17.59% of all variants) could be considered properly clustered. In contrast, the simplified ClinVar dataset—comprising 412 variants in its most reduced form—classifies only 6.96% of all variants. Therefore, our approach increased the number of assumed “known” variants by 152.73%. Furthermore, when these 412 known variants (LB and LP) were clustered into three groups, none of the clusters showed a clear distribution (p > 0.05). In contrast, the 7-tier classification system enabled a more distinct clustering-based separation of LB and LP.
After identifying that this separation occurs in this manner, the next step was to determine the cutoff point for VOUS variants in the 7-tier classifier. For this, we used rigid and adaptive classifiers. In the hierarchical clustering analysis under the adaptive classifier, 95% of the variants in the first cluster were in the LP category, and 93% of the variants in the second cluster were LB. Thus, both clusters achieved statistically significant separation (p < 0.001 for each). In the first cluster, the significant difference was driven by LP variants; in the second cluster, by LB variants. The rigid classifier, similar to the adaptive classifier, was able to significantly separate the variants in the first and second clusters (p < 0.001 for both) (Fig. 8E–H). In the first cluster, the significant difference arose from LP variants, whereas in the second cluster, it arose from non-LP variants (p < 0.001 for both).
External validation steps results
According to the results of both k-means and hierarchical clustering, the adaptive classifier yielded higher NMI and ARI scores compared to both the rigid classifier and the original three-tier classification (LB, VOUS, LP) (p < 0.05 for both NMI and ARI scores). The scores for the original classification and the rigid classification, however, were similar to each other (P > 0.05) (Fig. 9A–D). For this reason, we planned to make the final classification by partitioning the groups in accordance with the adaptive classifier.

Comparison of External Validation Metrics. (A) External Validation metrics comparison among Rigid, Adaptive, and Seven-Tier Classifiers. (B–D) An ANOVA/Kruskal–Wallis’s test on the [ARI/NMI/Purity] distributions revealed a significant overall effect (p < 0.05). Post-hoc comparisons (Tukey/Dunn) indicated that the Adaptive Classifier’s mean score differs significantly from both the Original and Rigid classifiers (p < 0.05), whereas no significant difference was observed between the Original and Rigid classifiers.
Final classification
The execution of the final categorization is illustrated in Fig. 10A. Prior to the establishment of the 7-tier classification system, 6.9% of the total variations were categorized as “known.” Following the refinement of the dataset and the implementation of a novel classification and clustering methodology, that proportion increased to 29.4%. This leap signifies a rise of 22.5% points, or almost a 4.3-fold relative increase. The revised method or dataset more precisely identifies known variants, significantly enhancing their recognition within the total collection (Fig. 10B–D).

Final Classification Scheme, Results and Comparative Datasets. (A) Flowchart outlining the final classification results. Panels (B) and (C) present the ClinVar classification dataset, derived from Ensembl and employed for a simplified analysis; this comparison incorporates the raw dataset used for supervised algorithm training, wherein the set of 412 known variants is presumed to represent 6.9% of the total dataset. Panels (D) and (E) include the 7-tier classification dataset, accounting for a total of 1744 variants (29.4% of the entire dataset).
Implementation of biological processed systems
In the subsequent stage, a potential three-stage clustering approach was implemented to evaluate the distribution of VOUS, LB, and LP variants across the identified clusters. This approach was applied to the 7-tier classification method, amino acid polarity status, and protein domains. For each parameter, the most suitable separation thresholds were determined (Supplementary Figs. 1–3).
Hotspot region prediction
Since the VOUS + + and VOUS + + predictions contain prediction patterns that are relatively closer to LP, when we cluster the regions containing these two predictions according to the other three VOUS subtypes (VOUS0, VOUS-, VOUS--), we alternatively obtained three significant regions (Fig. 11A). We did not include the LP and LB variants in this cluster, as this may introduce bias into the training dataset. Therefore, we only used the prediction dataset.
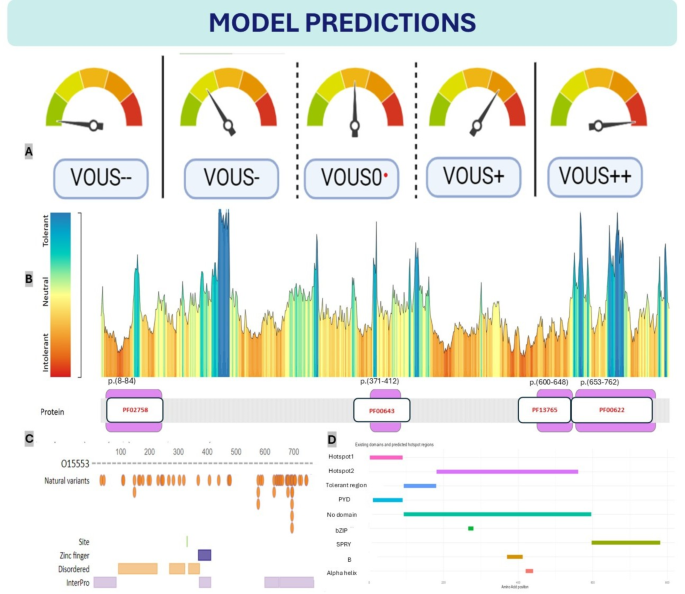
Model Predictions on Existing Domains (A) Seven-Tier Classification System, Ordinary 5-tier VOUS classification system (B) Protein tolerance landscape and domain mapping of pyrin protein (PF02758: PAAD/DAPIN/Pyrin domain, PF00643: B-box zinc finger, PF13765: SPRY-associated domain, PF00622: SPRY domain, GENCODE: ENST00000219596.1, RefSeq: NM_000243.2, UniProt: O15553) (C) The distributions of pyrin protein regions can be predicted via SWISS-MODEL. (Protein structure predictions for O15553 were obtained from SWISS-MODEL (https://swissmodel.expasy.org/repository/uniprot/O15553) under the Creative Commons Attribution 4.0 (CC BY 4.0) license. For further details, see Waterhouse et al., Nucleic Acids Res. 46, W296–W303 (2018). DOI: https://doi.org/10.1093/nar/gky427) (D) Existing domains, alternative predicted hotspot and tolerant regions. Two hotspot and one tolerant region predicted on the basis of VOUS variants. We did not include the LP and LB variants in this cluster, as their inclusion could introduce bias. The MEFV prediction app provides detailed information.
MetaDome is a web server that depicts genetic tolerance profiles across genes and specific protein domains by aggregating population variation and pathogenic mutations onto meta-domains at the level of amino acids42, and is widely used by genetic studies for structural and functional in silico analysis43,44. The MEFV gene encodes the three-dimensional structure of pyrin (Supplementary Fig. 4), which consists of modular domains such as an N-terminal pyrin domain (PYD) for inflammasome assembly, coiled-coil and B-box domains for structural integrity, and a C-terminal B30.2 (PRY-SPRY) domain involved in molecular recognition and autoinflammatory regulation1. According to the metadome browser, many MEFV gene hotspot regions most likely do not contain domains except SPRY-associated domains and pyrin domains (Fig. 11B). That is compatible with “evolutionary conservation does not mean includes hotspot region” and many examples are available45. Particulary, many hotspot regions in MEFV gene does not contain domains. Many intolerant regions detected outside of the domain regions9,46. For example, the region between amino acids 451 and 600 is considered a hotspot region, despite not containing any domains. In our model, this region is designated as “hotspot2.” Additionally, regions of significant genetic intolerance in the MEFV gene begin prior to position 190 and extend to include the hotspot2 region, continuing until position 600. The SPRY domain, which is the largest domain in the MEFV gene20, is associated with 12 P/LP variants and is responsible for a substantial portion of MEFV-related clinical manifestation according to Clinvar (3/12/2024). However, aside from the mutations identified in this domain, no significant alterations that disrupt protein structure have been reported1 and does not explain the exact relationship with FMF disease47. In fact, the most tolerable regions of the protein are also found within this domain. Consistent with this observation, our model neither classified this domain as a hotspot nor as a tolerable region.
However, the model predicted the region between amino acids 105 and 185 as a tolerable area, albeit starting at position 90. This caused the model to overlook the intolerant region between amino acids 90 and 112, highlighting a limitation of the current design. A notable success of the model is its precise alignment of hotspot 1 with the pyrin domain. The model also correctly predicted potential regions outside of domains, excluding SPRY, SPRY-associated, and pyrin domains, which shows a high level of accuracy. Nevertheless, the model failed to predict the zinc-finger domain located between amino acids 371 and 412. Despite this, it identified potential domains in three out of the four major domains, which is commendable.
Notably, the model’s prediction of the 451–600 region as a hotspot while distinguishing it from SPRY and SPRY-associated domains is a remarkable achievement. Additionally, the model’s ability to precisely predict the pyrin domain as a hotspot, despite missing certain other hotspot regions, underscores its potential. While the model demonstrates a reasonable predictive performance for hotspot and non-domain regions, there is substantial room for improvement. As a prototype, it is valuable in its current form but remains constrained by the limitations inherent to in silico tools and their reliance on ClinVar-reported variants. These predictions are not based on experimental or clinical study data. Therefore, the limitations of the model should be interpreted within the context of study design and resource constraints. In conclusion, our model suggests several alternative domain regions in addition to those predicted by many other protein prediction tools (Fig. 11C–D)42,48.
Discussion
In this study, we developed a gene-specific pipeline analysis for the use of an in silico tool and conducted it on the MEFV gene. Our pipeline analysis consisted of six essential steps: (1) determination of the optimum number of in silico tools; (2) multivariate outlier detection; (3) tree model building, internal validation, and tuning hyperparameters; (4) external validation of the prediction of known variants; (5) prediction of VOUS variants and implementation of rigid and adaptive classifiers methods; and (6) implementation of a grayscale approach for variant interpretation; (7) conducting clustering techniques ; (8) Final Classification.
Fuzzy logic principles served as the foundation for our motivation and inspiration31. Prior research classified VOUS variants into either benign or pathogenic categories via a similar approach to classical logic, specifically through recalibration of in silico methods or categorization of VOUS variant studies9,10. However, in silico approaches lack the ability to differentiate VOUS variations and classifying them as LB or LP can result in misinterpretation by genetic variant interpreters. However, ambiguous categories include a diverse range of options7,49,50. Therefore, it is essential to clearly define the level of uncertainty. Consequently, we used a grayscale to assist in the evaluation of variations. This approach provides an alternative methodology for health-care practitioners to interpret variants. Our findings not only apply to the classification of VOUS but also represent a tool for understanding MEFV gene variants. Furthermore, we identified the combination of in silico techniques that produced the best results for this gene. Additionally, we have suggested specific protein locations that could be the primary focus of functional studies for this gene.
Finally, we propose a specific pipeline that is generalizable to other genes (Fig. 12). The methodological superiority of this method over previous methods lies in its intolerance of missing values, the multivariate handling of outliers, the strict criteria used in feature selection, the use of ensemble methods such as bagging and boosting classifiers, and the final determination of results through the ensemble method of hard voting classifiers. Feature selection was not limited to a single method but included multiple criteria, such as Principal Component Analysis (PCA), Recursive Feature Elimination with Cross-Validation (RFECV), Importance Metrics (IM), and correlation analysis. Furthermore, we did not limit validation to hold-out or cross-validation methods; we excluded variants known to be pathogenic or benign from both the training and test sets and validated them in the external validation phase. Additionally, we used both k-means clustering and hierarchical clustering methods to validate the assignment results in the 5-step VOUS classification.

Generalized pipeline recommendations for other genes.
The findings of this study underscore the classification accuracies of various in silico tools, with newly developed tools such as Eve, Bayes Del, Varity, and AlphaMissense showing strong performance in the classification of gene variants individually. However, integrating the results from established tools such as Revel, SIFT, and MetaLR led to superior outcomes. This indicates two critical insights: (1) No single tool is definitively the best; a combined approach using both new and established in silico tools, when optimized, can achieve enhanced results. While certain algorithms offer notable enhancements in classification accuracy, it is crucial to employ gene-specific strategies to optimize their effectiveness. This emphasizes the necessity for ongoing research and development in this area.
The utilization of local outlier factor analysis and ensemble machine learning algorithms presents a promising approach for creating a more accurate MEFV variant predictor. By considering the unique complexity of autoinflammatory genes and accounting for a wider range of gene variants3,17, these alternative approaches have the potential to increase the accuracy of classification and prediction. Furthermore, the inclusion of extreme values in the analysis acknowledges the potential bias from machine learning algorithms, while optimizing model conditions can lead to more accurate outcomes. The three-dimensional approach and the use of local outlier factor analysis in our prediction model demonstrate a departure from traditional two-dimensional methods, ultimately contributing to a more comprehensive and robust analysis of MEFV gene variants. This collaborative strategy is designed to outperform traditional predictive models, thereby improving the ability to differentiate between pathogenic and benign variants in FMF diagnostics. The resulting predictive framework not only incorporates improved precision in variant categorization but also seeks to strengthen the fundamental principles of genetic counseling.
Recent developments in algorithmic approaches such as Eve, Varity, and Alpha Missense5,18 herald an era of enhanced performance in genomic variant prediction over their algorithmic antecedents. Despite these advancements, a monolithic algorithm demonstrating universally preeminent outcomes remains elusive. The moderate enhancements observed may well be a function of the training dataset’s breadth over gene-specific precision5,50. The assumption that an escalating dataset magnitude equates to optimal discernment is a misconception; individual genes display a complexity that defies one-size-fits-all solutions4,51,52. Nonetheless, the synergistic integration of established algorithms could eclipse the predictive accuracy of newly developed algorithms, emphasizing that the confluence of multiple computational perspectives may be requisite for the most incisive for variant prediction10.More than half of the variants in the MEFV gene are of unknown clinical importance, highlighting a significant gap in our understanding3. While only a few studies have attempted to classify these variants, they have focused primarily on predictions concerning already known variants. Our study takes a distinct approach by validating our findings against these known variants, setting our methodology apart from previous work that depended exclusively on predictive models. This validation process emphasizes the crucial role of empirical evidence in understanding the clinical ramifications of MEFV gene variants. Moreover, our contribution extends beyond the existing research by developing a classifier capable of predicting any type of variant, offering a more comprehensive tool for analysis and understanding the complexity of the MEFV gene.
Strengths
In this study, we have developed a complete set of gene-based pipelines for the rational reclassification of variation using in silico tools. Our approach, based on the principles of fuzzy logic, differs significantly from traditional methods that classify variants of unknown significance (VOUS) into two classes: benign or pathogenic. These conventional approaches are classifying variants of unknown significance (VOUS) into simple categories, such as the likely benign and likely pathogenic categories, which fail to capture the complexity of uncertainties. This leads to a higher likelihood of misclassification, thereby reducing the accuracy of clinical decision-making.
However, our method does not attempt to categorize VOUSs to deal with their inherent ambiguity. Rather, it serves as a tool and method to assist healthcare professionals in ordinally ranking the existing uncertainty and evaluating the variants. According to the ACMG criteria, the categorization of VOUSs is not solely the responsibility of in silico tools; clinicians, variant interpreters, and functional studies also play a crucial role in the evaluation process.
The novelty of the present work lies not only in the reconceptualization of VOUS variants but also in the development of a tool for the interpretation of MEFV gene variants. This method optimizes and integrates in silico tools in a systematic manner to determine the most feasible strategies for their combination. The method also identifies, for the first time, specific amino acid regions within the MEFV gene that warrant functional investigation.
Limitations
Our study has several limitations. First, the accuracy of our predictions is highly dependent on the in silico tools themselves. While these tools are invaluable for interpreting variants that are missing from population databases and lack specific functional studies, they often fail to produce optimal results due to limitations in their training datasets. The application of gene-specific strategies could improve the optimization of these variants. To address this issue, our aim was not to develop a generalized tool, but rather to establish a gene-specific approach to reduce uncertainties in the prediction of MEFV gene variants. The second limitation of the study was the use of GridSearchCV as the search algorithm. Although it generally produced more accurate results than RandomizedSearchCV, it took a considerable amount of time to complete. However, given the lack of studies on large datasets, GridSearchCV remains a more cost-effective and reliable approach compared to RandomizedSearchCV30,53,54.
The third limitation of our study stems from the implementation of outlier analysis, which led to the loss of some predicted variants and masked the effects of extreme values on a dataset. To overcome this, we adopted two strategies. (1) We used the LOF method, which can detect outliers in a multivariate way. We did not directly remove outliers from the dataset using the LOF method. We examined the performance metrics after weighing, removing, and retaining outliers and found that the results with outliers removed yielded the most favorable performance metrics; therefore, we removed the outliers.
The fourth limitation of the study is the model’s ability to accurately predict hotspot regions. Despite the model’s ability to effectively identify hotspot regions, tolerant sites, and domains, some of the predictions do not align with the existing domains or hotspot regions. This inter-regional mismatch can be explained in two different ways. Either the model detected the mismatches due to bias or insufficient training data, or these regions may indeed contain previously unknown hotspot regions. When comparing the results of predicted and detected hotspots, it is important to consider the following factors: (1) Conservation should not be equated with functionality or disease association, as not all conserved regions are disease-causing. (2) Despite the strict criteria used to select the training data, these classifications primarily rely on subjective clinical judgments. The nature of genes and proteins poses a challenge in identifying all conserved regions, particularly when there are insufficient functional annotations. Gain-of-function variants in the MEFV gene make genetic and functional predictions difficult.
The final limitation of the study pertains to the methods used for validating hotspot region predictions. While our approach adhered to rigorous statistical standards, we did not validate our predictions through in vivo and in vitro studies. Nonetheless, confirming the proposed hotspot locations through experimental and clinical means falls outside the scope of this research.
Conclusion
In conclusion, this study introduces a novel gene-specific workflow that leverages fuzzy logic and advanced in silico tools to address the challenges of genetic variant classification. By incorporating novel learning approaches, rigorous validation, and a grayscale interpretation framework, this methodology provides a more nuanced approach to interpreting VOUS and other complex genetic variants. Our findings not only enhance the classification of MEFV gene variants but also establish a scalable methodology applicable to other genes, which is crucial for advancing genomic medicine. This study serves as a reference for integrating sophisticated computational approaches into clinical practice, offering the potential to improve genetic counseling and patient management.
Future implications
With the advancement of genomic medicine, the techniques suggested in this study are the fundamental approach to dealing with the challenges that come with variant classification. This study employs complex and specific approaches to variant interpretation, focusing on precision medicine for specific genes. Further research should be aimed at improving these approaches with the help of in vivo and in vitro experiments and making this pipeline applicable to other clinically significant genes. Ultimately, this work lays the groundwork for a variant interpretation approach that integrates computational and clinical aspects to improve genetic counseling, boost diagnostic yield, and progress towards personalized medicine.
Data availability
Ensembl (www.ensembl.org), ClinVar (https://www.ncbi.nlm.nih.gov/clinvar/), dbNSFP 4.0 (https://sites.google.com/site/jpopgen/dbNSFP), and ensemble variant effect predictors were used for the data extraction steps. The AlphaMissense website (https://alphamissense.hegelab.org/prediction) was also utilized. All these tools are open-source. Our analysis results were published online as a Shiny WebApp (https://alaymd.shinyapps.io/MEFV_app/), and a GitHub repository was created at (mtarikalay/Integrative_Classifier_1).
Abbreviations
- AdaBoost:
-
Adaptive boosting
- CADD:
-
Combined annotation dependent depletion
- dbNSFP:
-
Database developed for functional prediction and annotation of all potential non-synonymous single-nucleotide variants (nsSNVs) in the human genome
- ExTC:
-
Extremely randomized tree classifier
- IM:
-
Importance metrics
- FMF:
-
Familial mediterranean fever
- LB:
-
Likely benign
- LOF:
-
Local outlier factor
- LP:
-
Likely pathogenic
- PCA:
-
Principal component analysis
- REVEL:
-
Rare exome variant ensemble learner
- RFE:
-
Recursive feature elimination
- RFECV:
-
Recursive feature elimination with cross-validation
- RF:
-
Random forest
- SIFT:
-
Sorting intolerant from tolerant
- SPRY:
-
SPla and the RYanodine receptor
- XGBoost:
-
Extreme gradient boosting
- VOUS:
-
Variation of unknown significance
References
Dundar, M. et al. Clinical and molecular evaluation of MEFV gene variants in the Turkish population: A study by the National genetics consortium. Funct. Integr. Genomics. 22, 291–315 (2022).
Wang, Q. et al. A dominant pathogenic MEFV mutation causes atypical pyrin-aSociated periodic syndromes. JCI Insight 8(19), e172975 (2023).
Van Gijn, M. E. et al. New workflow for classification of genetic variants’ pathogenicity applied to hereditary recurrent fevers by the international study group for systemic autoinflammatory diseases (INSAID). J. Med. Genet. 55, 530–537 (2018).
Hampel, H. et al. A practice guideline from the American college of medical genetics and genomics and the National society of genetic counselors: Referral indications for cancer predisposition assessment. Genet. Med. 17, 70–87 (2015).
Favalli, V. et al. Automated prediction of the clinical impact of structural copy number variations. Genet. Med. 103, e93 (2022).
Favalli, V. et al. Machine learning-based reclassification of germline variants of unknown significance: The RENOVO algorithm. Am. J. Hum. Genet. 108, 682–695 (2021).
Richards, S. et al. Standards and guidelines for the interpretation of sequence variants: A joint consensus recommendation of the American college of medical genetics and genomics and the association for molecular pathology. Genet. Med. Off J. Am. Coll. Med. Genet. 17, 405–424 (2015).
Pejaver, V. et al. Calibration of computational tools for missense variant pathogenicity classification and ClinGen recommendations for PP3/BP4 criteria. Am. J. Hum. Genet. 109, 2163–2177 (2022).
Accetturo, M., D’Uggento, A. M., Portincasa, P. & Stella, A. Improvement of MEFV gene variants classification to aid treatment decision making in Familial mediterranean fever. Rheumatology (Oxford) 59, 754–761 (2020).
Accetturo, M., Bartolomeo, N. & Stella, A. In-silico analysis of NF1 missense variants in ClinVar: translating variant predictions into variant interpretation and classification. Int. J. Mol. Sci. 21(3), e721 (2020).
Megantara, A. A. & Ahmad, T. A hybrid machine learning method for increasing the performance of network intrusion detection systems. J. Big Data 8, 142 (2021).
McDonald, E. F., Oliver, K. E., Schlebach, J. P., Meiler, J. & Plate, L. Benchmarking alphamissense pathogenicity predictions against cystic fibrosis variants. PLoS One 19, 1–20 (2024).
Ng, P. C. & Henikoff, S. S. I. F. T. Predicting amino acid changes that affect protein function. Nucleic Acids Res. 31, 3812–3814 (2003).
Liu, X., Li, C., Mou, C., Dong, Y. & Tu, Y. DbNSFP v4: A comprehensive database of transcript-specific functional predictions and annotations for human nonsynonymous and splice-site SNVs. Genome Med. 12, 103 (2020).
Song, X., Liu, X., Liu, F. & Wang, C. Comparison of machine learning and logistic regression models in predicting acute kidney injury: A systematic review and meta-analysis. Int. J. Med. Inf. 151, 104484 (2021).
Austin, P. C. & Steyerberg, E. W. Events per variable (EPV) and the relative performance of different strategies for estimating the out-of-sample validity of logistic regression models. Stat. Methods Med. Res. 26, 796–808 (2017).
Alay, M. T. An ensemble model based on combining BayesDel and revel scores indicates outstanding performance: Importance of outlier detection and comparison of models. Cerrahpasa Med. J. 48, 179–184 (2024).
Cheng, J. et al. Accurate proteome-wide missense variant effect prediction with alphamissense. Science 381, eadg7492 (2023).
Cunningham, F. et al. Ensembl 2022. Nucleic Acids Res. 50, D988–D995 (2022).
Alay, M. T., Demir, İ., Kirişçi, M., Three steps novel hard and margin ensemble machine learning method classifies uncertain mefv gene variants. medRxiv 2023.04.08.23288306 (2023). https://doi.org/10.1101/2023.04.08.23288306
Doane, D. P. & Seward, L. E. Measuring skewness: A forgotten statistic? J. Stat. Educ. 19, 1–18 (2011).
Groeneveld, R. A. & Meeden, G. Measuring skewness and kurtosis. J. R Stat. Soc. Ser. D Stat. 33, 391–399 (1984).
Alay, M. T., Yiğin, A. K., Seven, M., A new perspective on and isotretinoin in pregnancy: Pregnancy outcomes, evaluation of complex phenotypes, and importance of teratological counselling. medRxiv 2023.06.02.23290862 (2023). https://doi.org/10.1101/2023.06.02.23290862
Westfall, P. H., Kurtosis as Peakedness 1905–2014. R.I.P. Am. Stat. 68, 191–195 (2014).
Linnet, K. Testing normality of transformed data. J. R Stat. Soc. Ser. C (Appl. Stat.) 37, 180–186 (1988).
Raymaekers, J. & Rousseeuw, P. J. Transforming variables to central normality. Mach. Learn. 113, 4953–4975 (2024).
Filzmoser, P. & Gregorich, M. Multivariate outlier detection in applied data analysis: Global, local, compositional and cellwise outliers. Math. Geosci. 52, 1049–1066 (2020).
Belyadi, H. & Haghighat, A. Chapter 4 - Unsupervised machine learning: Clustering algorithms. in (eds. Belyadi, H. & Haghighat, A. B. T.-M. L. G. for O. and G. U. P.) 125–168 (Gulf Professional Publishing, 2021). https://doi.org/10.1016/B978-0-12-821929-4.00002-0
Hu, Y. H., Wu, R. Y., Lin, Y. C. & Lin, T. Y. A novel MissForest-based missing values imputation approach with recursive feature elimination in medical applications. BMC Med. Res. Methodol. 24, 269 (2024).
Olisah, C. C., Smith, L. & Smith, M. Diabetes mellitus prediction and diagnosis from a data preprocessing and machine learning perspective. Comput. Methods Programs Biomed. 220, 106773 (2022).
Kirişci, M. Data analysis for panoramic X-ray selection: Fermatean fuzzy type correlation coefficients approach. Eng. Appl. Artif. Intell. 126, 106824 (2023).
Puth, M. T., Neuhäuser, M. & Ruxton, G. D. Effective use of Spearman’s and Kendall’s correlation coefficients for association between two measured traits. Anim. Behav. 102, 77–84 (2015).
Xiao, C., Ye, J., Esteves, R. M. & Rong, C. Using Spearman’s correlation coefficients for exploratory data analysis on big dataset. Concurr. Comput. Pract. Exp. 28, 3866–3878 (2016).
Ahlqvist, E. et al. Novel subgroups of adult-onset diabetes and their association with outcomes: A data-driven cluster analysis of six variables. Lancet Diab. Endocrinol. 6, 361–369 (2018).
Larrañaga, P. et al. Machine learning in bioinformatics. Brief. Bioinform. 7, 86–112 (2006).
Brun, M. et al. Model-based evaluation of clustering validation measures. Patt. Recognit. 40, 807–824 (2007).
Campo, D. N., Stegmayer, G. & Milone, D. H. A new index for clustering validation with overlapped clusters. Expert Syst. Appl. 64, 549–556 (2016).
Akbarpour, N., Akbari, E. & Motameni, H. External clustering validity index based on extended similarity measures. J. Comput. Sci. 72, 102116 (2023).
Gupta, T. & Panda, S. P. Clustering validation of CLARA and k-means using silhouette & DUNN measures on Iris dataset. in International Conference on Machine Learning, Big Data, Cloud and Parallel Computing (COMITCon) 10–13 (IEEE, 2019). (2019).
Misuraca, M., Spano, M. & Balbi, S. B. M. S. An improved Dunn index for document clustering validation. Commun. Stat. Methods 48, 5036–5049 (2019).
Zhang, W. et al. Modulation format identification using the Calinski–Harabasz index. Appl. Opt. 61, 851–857 (2022).
Wiel, L. et al. Pathogenicity analysis of genetic variants through aggregation of homologous human protein domains. Hum. Mutat. 40, 1030–1038 (2019). MetaDome.
Ashrafi, M. R. et al. Clinical and molecular findings of autosomal recessive spastic ataxia of Charlevoix Saguenay: An Iranian case series expanding the genetic and neuroimaging spectra. Cerebellum 22, 640–650 (2023).
Rabbani, B. et al. Pancreatitis as a main consequence of APOC2-related hypertriglyceridemia: The role of nonsense and frameshift variants. Int. J. Genomics 2024, 6653857 (2024)
Walker, D. R. et al. Evolutionary conservation and somatic mutation hotspot maps of p53: Correlation with p53 protein structural and functional features. Oncogene 18, 211–218 (1999).
Kishida, D. et al. Variables for differential diagnosis of Familial mediterranean fever: Multiple correspondence analysis of a large Japanese cohort. Mod. Rheumatol. 34, 784–790 (2024).
Papin, S. et al. The SPRY domain of Pyrin, mutated in Familial mediterranean fever patients, interacts with inflammasome components and inhibits proIL-1beta processing. Cell. Death Differ. 14, 1457–1466 (2007).
Waterhouse, A. et al. SWISS-MODEL: Homology modelling of protein structures and complexes. Nucleic Acids Res. 46, W296–W303 (2018).
Burdon, K. P. et al. Specifications of the ACMG/AMP variant curation guidelines for myocilin: Recommendations from the Clingen glaucoma expert panel. Hum. Mutat. 43, 2170–2186 (2022).
Nykamp, K. et al. Sherloc: A comprehensive refinement of the ACMG-AMP variant classification criteria. Genet. Med. Off J. Am. Coll. Med. Genet. 19, 1105–1117 (2017).
Garcia, F. A., de Andrade, O., Palmero, E. & E. S. & I. Insights on variant analysis in silico tools for pathogenicity prediction. Front. Genet. 13, 1010327 (2022).
Waring, A. et al. Data-driven modelling of mutational hotspots and in Silico predictors in hypertrophic cardiomyopathy. J. Med. Genet. 58, 556–564 (2021).
Zhao, Y., Zhang, W. & Liu, X. Grid search with a weighted error function: Hyper-parameter optimization for financial time series forecasting. Appl. Soft Comput. 111362 (2024).
Adzhubei, I., Jordan, D. M. & Sunyaev, S. R. Predicting functional effect of human missense mutations using PolyPhen-2. Curr. Protoc. Hum. Genet. 76 (1), 7–20 (2013).
Acknowledgements
My elder brother IMA and uncle MA who are dedicated to science and life-long learning.
Funding
None.
Author information
Authors and Affiliations
Contributions
MTA collected and prepared the data, designed the study, wrote the manuscript, and took responsibility for the integrity of the work. MTA approved the final version of the manuscript.
Corresponding author
Ethics declarations
Ethics approval and consent to participate
Does not require for the study.
Competing interests
The authors declare no competing interests.
Additional information
Publisher’s note
Springer Nature remains neutral with regard to jurisdictional claims in published maps and institutional affiliations.
Electronic supplementary material
Below is the link to the electronic supplementary material.
Rights and permissions
Open Access This article is licensed under a Creative Commons Attribution-NonCommercial-NoDerivatives 4.0 International License, which permits any non-commercial use, sharing, distribution and reproduction in any medium or format, as long as you give appropriate credit to the original author(s) and the source, provide a link to the Creative Commons licence, and indicate if you modified the licensed material. You do not have permission under this licence to share adapted material derived from this article or parts of it. The images or other third party material in this article are included in the article’s Creative Commons licence, unless indicated otherwise in a credit line to the material. If material is not included in the article’s Creative Commons licence and your intended use is not permitted by statutory regulation or exceeds the permitted use, you will need to obtain permission directly from the copyright holder. To view a copy of this licence, visit http://creativecommons.org/licenses/by-nc-nd/4.0/.
About this article

Cite this article
Alay, M.T. A novel seven-tier framework for the classification of MEFV missense variants using adaptive and rigid classifiers. Sci Rep 15, 9054 (2025). https://doi.org/10.1038/s41598-025-94142-7
Received:
Accepted:
Published:
Version of record:
DOI: https://doi.org/10.1038/s41598-025-94142-7
