
Fig. 2: North Atlantic missing storm adjustment and adjusted basin-wide hurricane and major hurricane frequency.
From: Changes in Atlantic major hurricane frequency since the late-19th century
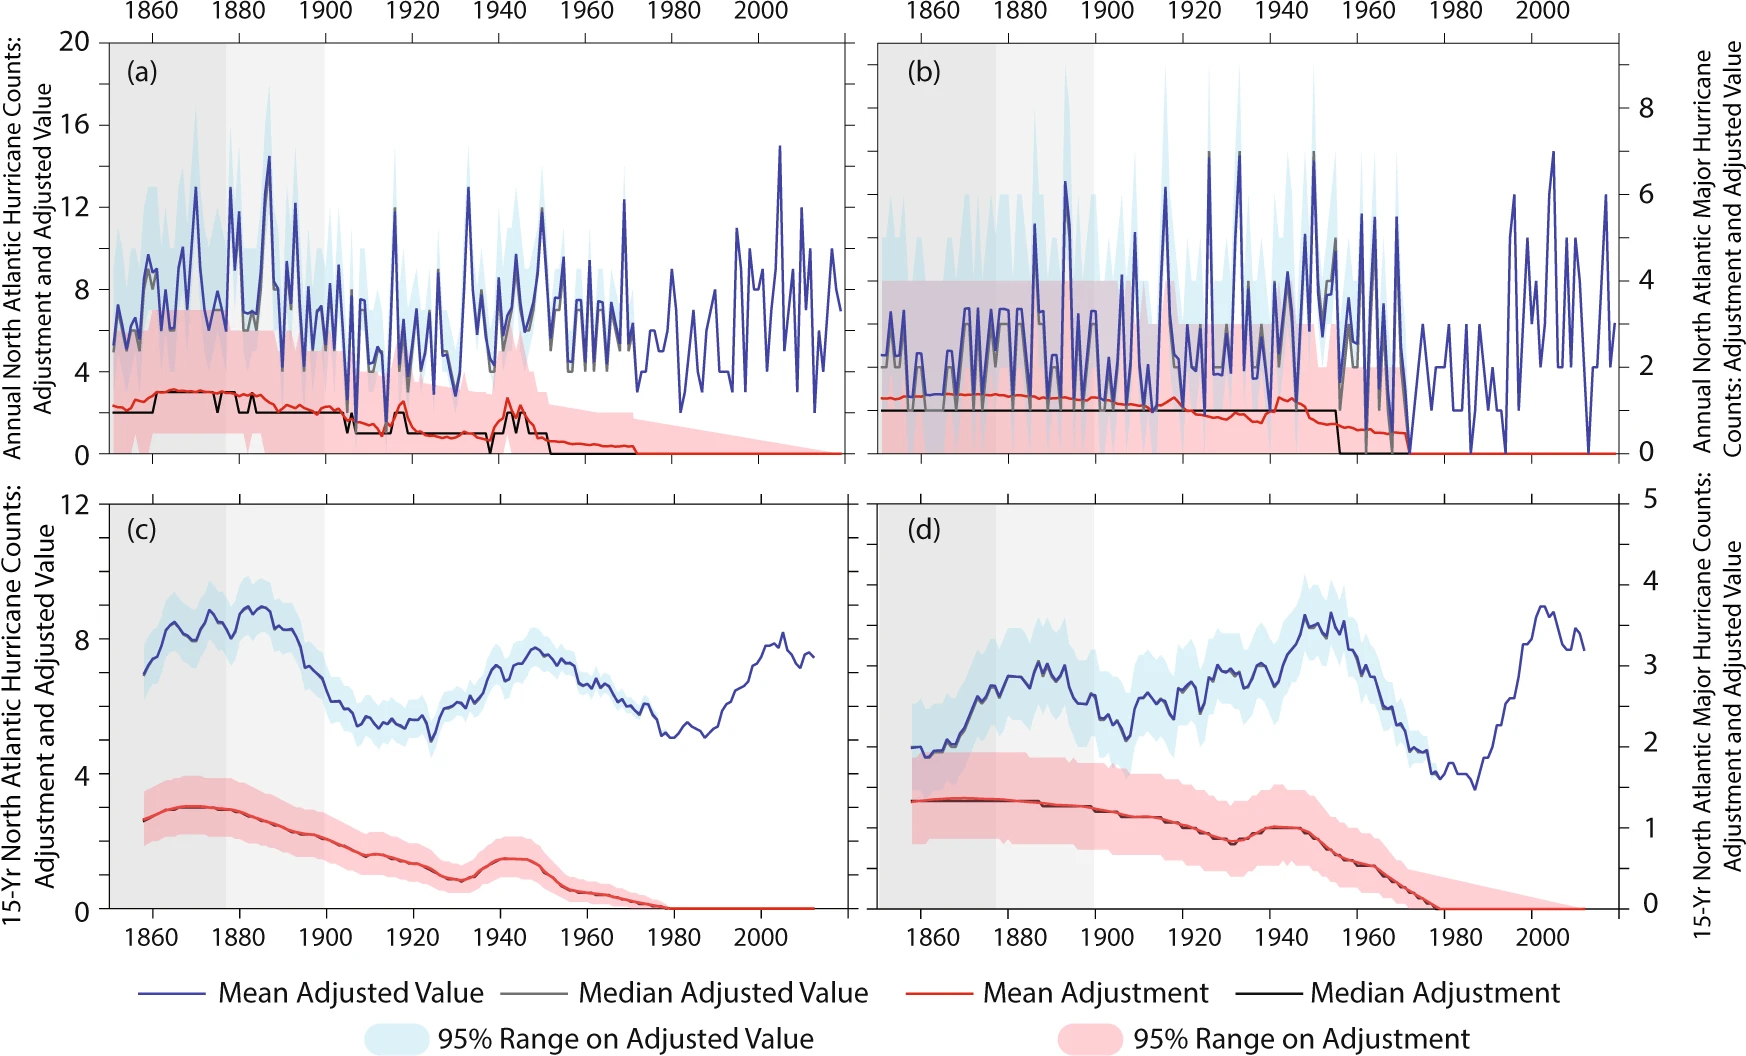
Top panels a, b show adjusted values for each year 1851–2019, bottom panels c, d show the values for the 15-year centered average of basin-wide frequency; the frequency of North Atlantic (NA) hurricanes is shown on the left and of NA major hurricanes on the right. In each panel, the red thick line shows the mean estimate of the missing storm adjustment, thick black line shows the median estimate, and the pink shading shows the 95% range on the adjustment based on a bootstrap resampling of the adjustments; thick blue line shows the mean estimate on basin-wide frequency (sum of frequency recorded in version 2 of the North Atlantic Hurricane Database, HURDAT2, ref. 33, and the adjustment developed in this study), thin black line shows the median estimate of the adjusted frequency, the sky-blue shading shows the 95% range on the adjusted value based on a bootstrap resampling of the adjustments. In the bottom panels c, d a dotted gray line shows the 15-year centered average of the recorded HURDAT2 counts (seen also in Fig. 1c, d). Gray background shading is as in Fig. 1, and highlights times where we have reduced confidence in the frequency estimates even after adjusting for likely missing storms.
